Download
1 / 3
50 likes | 660 Views
Managerial Economics Cost Function. Consider estimation of a short- run average variable cost function of the form AVC= a + bQ + cQ 2 Using time-series data, the estimation procedure produces the following computer output: DEPENDENT VARIABLE: AVC R- SQUARE P- VALUE ON F

E N D
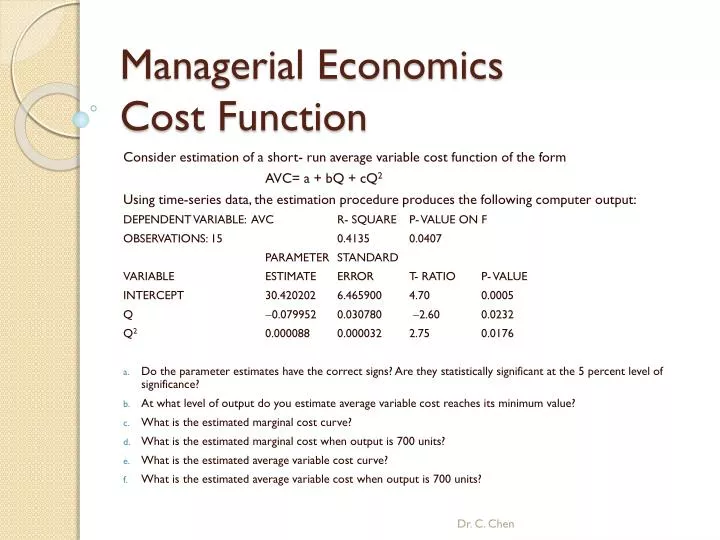
Managerial Economics Cost Function Consider estimation of a short- run average variable cost function of the form AVC= a + bQ + cQ2 Using time-series data, the estimation procedure produces the following computer output: DEPENDENT VARIABLE: AVC R- SQUARE P- VALUE ON F OBSERVATIONS: 15 0.4135 0.0407 PARAMETER STANDARD VARIABLE ESTIMATE ERROR T- RATIO P- VALUE INTERCEPT 30.420202 6.465900 4.70 0.0005 Q 0.079952 0.030780 2.60 0.0232 Q2 0.000088 0.000032 2.75 0.0176 Do the parameter estimates have the correct signs? Are they statistically significant at the 5 percent level of significance? At what level of output do you estimate average variable cost reaches its minimum value? What is the estimated marginal cost curve? What is the estimated marginal cost when output is 700 units? What is the estimated average variable cost curve? What is the estimated average variable cost when output is 700 units? Dr. C. Chen
Managerial Economics Cost Function Consider estimation of a short- run average variable cost function of the form AVC= a + bQ + cQ2 Using time-series data, the estimation procedure produces the following computer output: DEPENDENT VARIABLE: AVC R- SQUARE P- VALUE ON F OBSERVATIONS: 15 0.4135 0.0407 PARAMETER STANDARD VARIABLE ESTIMATE ERROR T- RATIO P- VALUE INTERCEPT 30.420202 6.465900 4.70 0.0005 Q 0.079952 0.030780 2.60 0.0232 Q20.000088 0.000032 2.75 0.0176 a. Do the parameter estimates have the correct signs? Are they statistically significant at the 5 percent level of significance? For an U-shaped quadratic function, a > 0, b < 0, and c > 0, should be satisfied. All the parameter estimates have the correct signs and all the p-values (< 0.05) confirm the significance. At what level of output do you estimate average variable cost reaches its minimum value? Minimum AVC occurs at Q = b/2c = (0.079952)/0.000088 = 909 Dr. C. Chen
Managerial Economics Cost Function Consider estimation of a short- run average variable cost function of the form AVC= a + bQ + cQ2 Using time-series data, the estimation procedure produces the following computer output: DEPENDENT VARIABLE: AVC R- SQUARE P- VALUE ON F OBSERVATIONS: 15 0.4135 0.0407 PARAMETER STANDARD VARIABLE ESTIMATE ERROR T- RATIO P- VALUE INTERCEPT 30.420202 6.465900 4.70 0.0005 Q 0.079952 0.030780 2.60 0.0232 Q20.000088 0.000032 2.75 0.0176 What is the estimated marginal cost curve? SMC = a + 2bQ + 3cQ2= 30.42 0.16Q+0.00026Q2 What is the estimated marginal cost when output is 700 units? SMC = 30.42 0.16(700)+0.00026(700)2 = 45.8 What is the estimated average variable cost curve? AVC= 30.42 0.08Q + 0.000088Q2 What is the estimated average variable cost when output is 700 units? AVC= 30.42 0.08(700) + 0.000088(700)2= 17.5 Dr. C. Chen