Download
1 / 30
300 likes | 497 Views
Results by the IGEC2 collaboration on 2005 data. Gabriele Vedovato for the IGEC2 collaboration. HighLights. 6 month of data [ May 20 - Nov 15, 2005] AURIGA-EXPLORER-NAUTILUS - data exchanged ALLEGRO - data available only for a follow-up investigation

E N D
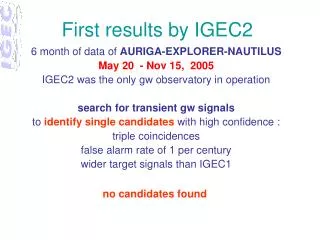
Results by the IGEC2 collaboration on 2005 data Gabriele Vedovato for the IGEC2 collaboration
HighLights • 6 month of data [May 20 - Nov 15, 2005] • AURIGA-EXPLORER-NAUTILUS - data exchanged • ALLEGRO - data available only for a follow-up investigation • IGEC2 was the only gw observatory in operation • Search for GWB signals (wider target signals than IGEC1) was tuned to identify single candidates with high confidence : • only triple coincidences • false alarm rate = 1/century • NO CANDIDATES FOUND !!!
DATA ANALYSIS PIPELINE : BASED ON TIME COINCIDENCE Fourier amplitude of gwb arrival time • Exchange of candidate events using a protocol analogous to the one used in IGEC1 analysis • Candidate events lists are produced by each group using a search optimized for -like signals • the amplitude H [Hz-1] exchanged is the fourier component of h, gw strain • each group added a “secret time shift” to the time of the candidate events • no detection efficiency is used !!! • Cross check of the filter pipeline on a sample day of raw data. • Tuning of the analysis to a possible detection requiring an identification of the candidates with high confidence fixing the three-fold false alarm to 1 over 100 years (an upper limit, at the present sensitivity of the bar detectors, is not an interesting scientific result) • “a priori”tuning of the parameters (search thresholds, coincidence window and working periods) by a blind analysis of the background characteristics • Exchange of the secret time shifts and search for possible candidates and follow-up investigations.
THE DETECTORS AURIGA NAUTILUS EXPLORER ALLEGRO
FROM IGEC1 TO IGEC2 IGEC 1 1997-2000 IGEC 2 2005
Detector Acceptance • The four antennas are coalligned and the received signals are projected onto detectors in the same way regardless of the source direction
DATA EXCHANGE AURIGA- EXPLORER- NAUTILUS MAY 20 –NOV 15, 2005
96 % 87 % 86 % OPERATION TIME – MAY 20 –NOV 15, 2005(AURIGA- EXPLORER- NAUTILUS) 180 days HIGH DUTY FACTOR Data from ALLEGRO to be added • no detector 0.6 days • Single 3.6 days • Double 45.0 days • Triple130.8days days of operation
IGEC 1 1997-2000 typical values EXPLORER NAUTILUS AURIGA Noise of Detectors vs Timein terms of Fourier component H AURIGA NAUTILUS EXPLORER
EXPLORER SNR > 4.0 NAUTILUS SNR > 4.0 AURIGA SNR > 4.5 AMPLITUDE vs TIMEOF THE EXCHANGED EVENTS
AURIGA SNR > 4.5 NAUTILUS SNR > 4.0 EXPLORER SNR > 4.0 AMPLITUDE DISTRIBUTIONOF THE EXCHANGED EVENTS
AURIGA EXPLORER NAUTILUS Integrated time during which the detector exchange threshold has been lower than Ht
st AURIGA COINCIDENCE WINDOW • Coincidence window IGEC1 style • |t1 –t2| < bt * sqrt [2(t1) + 2(t2)] • for the 3 detector pairs bt=4.47 ensure a contribution to false dismissal < 15% according to Byenaimé-Tchebychev • For EXPLORER and NAUTILUS the t was fixed at 10 ms
Total number of Trials Mean number of accidental triples on 131 days THREE-FOLD COINCIDENCES BACKGROUNDALL THE EXCHANGED DATA SNR4.5 AU SNR4.0 EX-NA+/- 2200 Time Shift (5 sec) EX-AU & NA-AU
DATA SELECTION To set the background to 1 false alarm per century the background must be reduced by a factor 600 : we decided to perform one composite search made by the OR among 3 different procedures data selection Selection A : based on false alarms statistic & data quality (detection efficiency not available) Selection B : d-like signals (d-like signals are detected with the same amplitude H by each detector) Selection C : d-like signals IGEC1-Style (for comparison)
Data Selection A – Same SNR Thresholds • SNR > 4.95 for AU, EX & NA • Equal data quality • Target signals : better detected by NA-EX than AU • 0.396 false alarm/century
Data Selection B – Different SNR Thresholds • AU-SNR > 7.00 : EX-SNR & NA-SNR > 4.25 • Target signals : d-like • 0.572 false alarm/century
AURIGA NAUTILUS EXPLORER AURIGA NAUTILUS EXPLORER AURIGA NAUTILUS EXPLORER • Data Selection C – Common Thresholds IGEC1-style • search thresholds @ H=1.2, 1.3, 1.4, 1.5, …, 2.4, …, 3.0*10-21/Hz • target d-like signals • 0.134 false alarm/century
[Hz-1] t • Data Selection C – Common Thresholds IGEC1-style OBSERVATION TIMES Integrated time during which the 3 detectors exchange threshold has been lower than search threshold Ht
Correlation between 3 data selections TOTAL # TRIALS = 19.355.600# ACCIDENTAL TRIPLE COINCIDENCES = 17.121.1891 False Alarm/Century
CUMULATIVE FALSE ALARM DISTRIBUTION of the 3 data selections Empirical estimate of the probability of a false detection: 3.63 10-3 over 130 days 1.0 false alarm / century statistical uncertainty: 1 0.02 10-3 systematic uncertainty below 0.1 10-3 tested with independent pipelines & different choices of time shifts The accidental coincidences are the “union” of the accidental coincidences for each data selection counting only once the repeated accidental coincidences.
TEST THE NULL HYPOTHESIS • The null hypothesis will be rejected if at least one coincidence is found in zero lag analysis. • If null hypothesis is not confirmed: • the coincidence is not explained by accidental coincidences with 99.637% 0.006% (3) • the coincidence can be due to correlated signal or noise in the 3 detectors • a follow-up a posteriori analysis is necessary to characterize the coincidences
CONFIDENCE INTERVALS • Set a confidence interval on the mean number of coincidences due to any source of correlated noise or signal assuming a poisson model. • Confidence belt construction: • Based on Feldman&Cousins construction • the noise model is a Poisson distribution fitting the empirical estimates of the accidental coincidences with mean noise b = 0.00364 0.00006(3)events observed = 1 Average signals = 0.05 to 5.14 observed = 0 Average signals = 0 to 3.09
FOLLOW-UP PLANNED ANALYSIS • Additional checks for mistakes in the network analysis • It will not affect the confidence of the rejection of the null • The follow-up results will be interpreted in terms of likelihood or “degree of belief” (subjective confidence) by the collaboration • Investigation on h(t) data will try to discriminate among known possible sources (gravitational waves, electromagnetic or seismic disturbances, …). The h(t) data will be used to implement network coherent tests based on cross-correlation • Data from ALLEGRO will be added, in particular h(t) and list of candidates. • IGEC2 will investigate on simultaneous observations by other kind of detectors (neutrinos, gamma, x …)
Burst Rate detectable [year-1] 95% coverage Burst amplitude H at detector [Hz-1] RESULTS • On September 25, once defined all the analysis parameters, the secret time shifts were exchanged • No candidate event was foundand the null hypothesis was not rejected • One of the data subset has been used to calculate the uninterpreted upper limit to be compared with the previous one of IGEC1
FINAL REMARKS Strengths: • 3 bar detectors easily survey with high duty cycle and very low false alarms: possible identification of single candidates at low SNR with very high confidence • IGEC2 searches for a broader class of signals than IGEC1 • The blind search in the statistical sense makes the statistical interpretation non-controversial Weaknesses: • IGEC2 (as IGEC1) lacks a measurement of detection efficiency • Interpretation of the confidence interval in terms of equivalent gravitational waves from a selected source model was NOT possible • The tuning of the analysis considered only generic predictions of the detection efficiency • Poor sensitivity with respect to LIGO IGEC2 upper limits not interesting any more Short term opportunities: • improved methodologies of network data analysis have already been tried (coherent data analyses) • IGEC2 has been requested to collaborate with LIGO during its current scientific run
NA Time Shift EX Time Shift CUMULATIVE FALSE ALARM AU-NA/EX TIME SHIFT DISTRIBUTION of the 3 data selections False alarms are uniformely distributed regardeless of the time shift of EX & NA respect to AU Measurement of statistical uncertainty on mean accidental coincidences