Download
1 / 33
330 likes | 504 Views
Interannual Variability Of Primary Production and Carbon Fluxes along the U.S. Eastern Continental Shelf: Impact of Atmospheric Forcing?. Bronwyn Cahill 1,2 , Katja Fennel 3 & John Wilkin 2 1 Informus GmbH, Berlin, Germany 2 Institute of Marine and Coastal Science, Rutgers University, USA

E N D
Interannual Variability Of Primary Production and Carbon Fluxes along the U.S. Eastern Continental Shelf: Impact of Atmospheric Forcing? Bronwyn Cahill1,2, Katja Fennel3 & John Wilkin2 1Informus GmbH, Berlin, Germany 2Institute of Marine and Coastal Science, Rutgers University, USA 3Dept of Oceanography, Dalhousie University, Canada
COASTAL CARBON FLUXES ALONG THE U.S. EASTERN CONTINENTAL SHELF: U.S. ECOS U.S. ECoS Team Marjorie Friedrichs (VIMS); Eileen Hofmann (ODU); Bronwyn Cahill (Rutgers University); Cathy Feng (VIMS); Kim Hyde (NOAA NMFS); Cindy Lee (Stony Brook); Antonio Mannino (NASA GSFC) Ray Najjar (Penn State);SergioSignorini (NASA GSFC) HanqinTian (Auburn University); Dan Tomaso (Penn State); Yongjin Xiao (VIMS); JianhongXue (VIMS); Qichun Yang (Auburn University); John Wilkin (Rutgers University)
Regional differences in continental shelves’ potential to be a source or sink for atmospheric CO2 • Important to view regions as distinct provinces (Cai et al 2006, Borges et al, 2005). Global distribution of annual sea-air CO2 flux measurements gC m-2 yr-1 (Cai et al, 2006)
U.S. ECoS Research Objectives: Land Ecosystem Model evaluation assimilation Coupled BGC/Circ Model evaluation assimilation Satellite Data In situ Data Evaluate continental shelf carbon cycling processes including: biological processes; air sea exchange of CO2; exchange at shelf break; exchange at land-ocean interface; burial Examine sensitivity of these processes to variability in: river discharge, nutrient loadings, freshwater inflow, precipitation, ocean/air temperature, winds Coastal Carbon Fluxes Climate/ Land-Use Changes
OBJECTIVES • Inter-annual variability of primary production and air-sea CO2 flux in three sub-regions of US east coast continental shelf. • Investigate sensitivity of air-sea CO2 flux to perturbations in atmospheric forcing. • Identify the important processes responsible for producing year to year changes in air-sea CO2 flux.
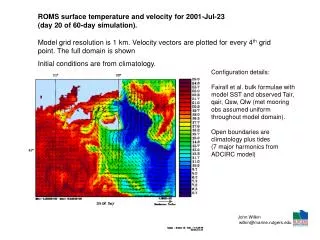
Coupled Biogeochemical Circulation Model: NENA(NorthEast North American shelf)
NENA Model Specifications GOM MAB SAB Spring Chl (mg m-3)
X X X X X X X X • Key Biological Model Properties: • Nitrogen dynamics (Fennel et al., 2006); Carbon dynamics (Fennel et al., 2008) • DOM dynamics (Druon et al., 2010; J. Xue) • Multiple P/Z (in development Y. Xiao) • OCMIP standard for carbonate system • Wanninkhof (1992) gas exchange
2 CASE STUDIES Future scenario characterized by ~ 2oC air temperature increase
S N alongshore decrease in wind speed 2004 2005 Future - Present 2006 2007
Winter Spring Summer Fall
Model evaluation with satellite data Model vs. Satellite SST Satellite-model statistical comparisons Taylor/Target diagrams evaluation (Jolliff et al., 2008) NENA1 satellite SST NENA2 diffce diffce Subregions: NENA satellite Hofmann et al., 2011 Hofmann et al., 2008, 2011, Druon et al., 2010
But how do we evaluate carbon fluxes? We generally need to examine in situ data NENA annual primary productivity gC m-2 yr-1 annual PP gC m-2 yr-1 Model shows reasonable comparison to in situ PP data, considering variability involved
“PRESENT” AIR-SEA CO2 FLUXES • SOME CHARACTERISTICS: • Generally acts as a sink • Clear alongshelf gradient • Interannual variability • Regional differences • “Future” – shift in position of alongshore gradient “FUTURE” Positive ocean is a sink of CO2 Negative ocean is a source of CO2
GOM NENA 1.4 sea-air CO2 fluxes 2004 to 2007 & VDK et al., 2011 VDK et al., 2011, observations from 2004 to 2008 2004 2005 2006 2007 NENA Net Annual Flux: -1.77 mol C m-2 y-1; VDK et al., 2008 Net Annual Flux: 0.34 mol C m-2 y-1 Cahill et al., in prep
GOM NENA 1.4 pCO2 2004 to 2007 & VDK et al., 2011 VDK et al., 2011, observations from 2004 to 2008 2004 2005 2006 2007 Spring Autumn Cahill et al., in prep
GOM NENA 1.4 & NENA 4.1 Sea-Air CO2 Flux & pCO2 2004 to 2007 Spring Autumn Present Net Annual Flux: -1.77 mol C m-1 y-1 Future Net Annual Flux: -1.74 mol C m-2 y-1 Cahill et al., in prep
MAB NENA 1.4 sea-air CO2 fluxes 2004 to 2007 & Takahashi et al., 2009 Takahashi et al., 2009 2004 2005 2006 2007 NENA NET ANNUAL FLUX: -1.2 MOL C M-2 Y-1; TAKAHASHI ET AL., 2009: -1.84 MOL C M-2 Y-1 “VARIOUS” OTHER ESTIMATES: -0.6 to -1.7 MOL C M-2 Y-1 (Fennel et al., 2008, Previdi et al., 2008, DeGrandpre et al., 2002) Cahill et al., in prep
MAB NENA 1.4 pCO2 2004 to 2007 & Takahashi et al., 2009 Takahashi et al., 2009 2004 2005 2006 2007 Spring Autumn Cahill et al., in prep
MAB NENA 1.4 & NENA 4.1 Sea-Air CO2 Flux & pCO2 2004 to 2007 Spring Autumn Present Net Annual Flux: -1.2 mol C m-1 y-1 Future Net Annual Flux: -1.21 mol C m-2 y-1 Cahill et al., in prep
SAB NENA 1.4 sea-air CO2 fluxes 2004 to 2007 & Jiang et al., 2008 Jiang et al., 2008, observations from 2005/2006 2004 2005 2006 2007 NENA Net Annual Flux: -0.51 mol C m-2 y-1; Jiang et al., 2008 Net Annual Flux: -0.48 mol C m-2 y-1 Cahill et al., in prep
SAB NENA 1.4 pCO2 2004 to 2007 & Jiang et al., 2008 Jiang et al., 2008, observations from 2005/2006 2004 2005 2006 2007 Spring Autumn Cahill et al., in prep
SAB NENA 1.4 & NENA 4.1 Sea-Air CO2 Flux & pCO2 2004 to 2007 Spring Autumn Present Net Annual Flux: -0.51 mol C m-1 y-1 Future Net Annual Flux: +0.2 mol C m-2 y-1 Cahill et al., in prep
DISSOLVED INORGANIC CARBON (DIC) Approximate difference in annually integrated flux using a second-order Taylor series expansion
Process Identification Using Taylor Series Decomposition FUTURE – PRESENT ∆CO2 FLUXALL TERMS CO2 FLUXSchmidt Number = f(T)Solubility = f(T,S)Winds = f(U,V) pCO2 = f(TA, TIC, T,S) pCO2TemperatureSalinityBiological Effects, NEPTIC/TA mixing (Adapted from Previdi et al., 2009; Colman et al., 1997; Wetherald & Manabe, 1988)
∆CO2 FLUXALL TERMS Schmidt=f(T) Solubility=f(T,S)
∆CO2 FLUXALL TERMS Winds=f(U,V) pCO2=f(TA, TIC, T,S)
∆CO2 FLUXALL TERMS Net Ecosystem Production NEP=f(PP,Rem) Rate of organic carbon accumulation (mol C m-3yr-1) NEP=f(PP, Rem)
∆CO2 FLUX VS ∆NEP ∆CO2 FLUX 2004 2005 ∆NEP 2004 2005
∆CO2 FLUX VS ∆NEP ∆CO2 FLUX 2006 2007 ∆NEP 2006 2007
CONCLUSIONS • U.S. East Coast Continental Shelf is an overall sink of atmospheric CO2 • Alongshelf gradient (S-N) in magnitude of flux, regional differences. • Potentially important inter-annual variability in air-sea CO2 fluxes in all sub regions of U.S. East Coast Continental Shelf. • Winds and pCO2 dominate the response of sub-regions to variability in atmospheric forcing. • Regime shifts (sink source) occur in response to “future” perturbations in atmospheric forcing. • Complex picture of sink / source regimes along US East Coast Continental Shelf!