Download
1 / 103
1.1k likes | 1.76k Views
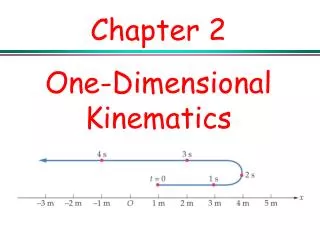
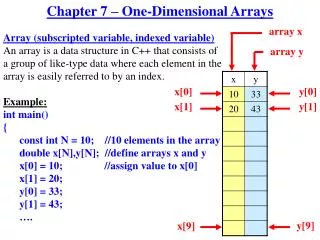
One Dimensional Kinematics - Chapter Outline. Lesson 1 : Describing Motion with Words Lesson 2 : Describing Motion with Diagrams Lesson 3 : Describing Motion with Displacement vs. Time Graphs Lesson 4 : Describing Motion with Velocity vs. Time Graphs

E N D
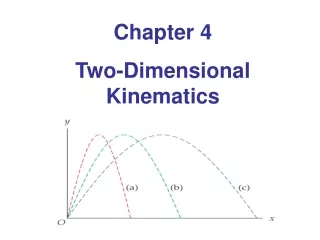
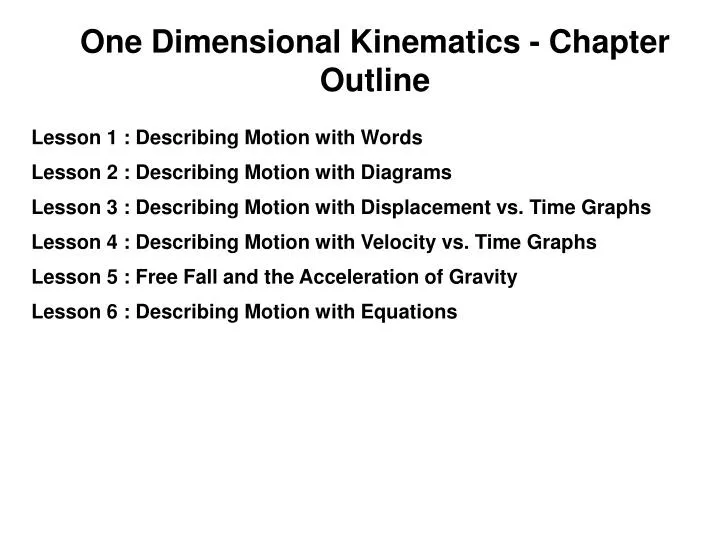
One Dimensional Kinematics - Chapter Outline Lesson 1 : Describing Motion with Words Lesson 2 : Describing Motion with Diagrams Lesson 3 : Describing Motion with Displacement vs. Time Graphs Lesson 4 : Describing Motion with Velocity vs. Time Graphs Lesson 5 : Free Fall and the Acceleration of Gravity Lesson 6 : Describing Motion with Equations
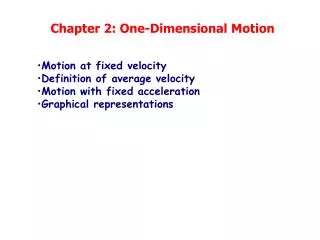
1.Describing Motion with Words • Know the Language of Kinematics • Differentiate Scalars and Vectors • Understand Distance and Displacement • Be able to calculate Speed and Velocity • Be able to calculate Acceleration
Introduction to the Language of Kinematics • Mechanics - the study of the motion of objects. • Kinematics is the science of describing the motion of objects using words, diagrams, numbers, graphs, and equations. Kinematics is a branch of mechanics.
Scalars and Vectors • Scalars are quantities that are fully described by a magnitude (or numerical value) alone. • Vectors are quantities that are fully described by both a magnitude and a direction.
Distance and Displacement • Distance is a scalar quantity that refers to "how much ground an object has covered" during its motion. • Displacement is a vector quantity that refers to "how far out of place an object is"; it is the object's overall change in position. Displacement has a direction. • Example: consider the motion depicted in the diagram below. A physics teacher walks 4 meters East, 2 meters South, 4 meters West, and finally 2 meters North. the physics teacher has walked a total distance of 12 meters, her displacement is 0 meters.
example • Use the diagram to determine the resulting displacement and the distance traveled by the skier during these three minutes. The skier covers a distance of (180 m + 140 m + 100 m) = 420 m and has a displacement of 140 m, rightward.
example • What is the coach's resulting displacement and distance of travel? The coach covers a distance of (35 yds + 20 yds + 40 yds) = 95 yards and has a displacement of 55 yards, left.
Check Your Understanding • 1. What is the displacement of the cross-country team if they begin at the school, run 10 miles and finish back at the school? • 2. What is the distance and the displacement of the race car drivers in the Indy 500? The displacement of the runners is 0 miles. The displacement of the cars is somewhere near 0 miles since they virtually finish where they started. Yet the successful cars have covered a distance of 500 miles.
Velocity vs. Speed • VELOCITY • change in DISPLACEMENT occurring over time • Includes both MAGNITUDE and DIRECTION • VECTOR • SPEED • change in DISTANCE occurring over time • Includes ONLY MAGNITUDE • SCALAR
Average Velocity/Speed Equations • As an object moves, it often undergoes changes in speed. The average speed during the course of a motion is often computed using the following formula: • In contrast, the average velocity is often computed using this formula: d is total displacement • The direction of velocity is the same as the direction of motion.
example Jim gets on his bike and rides 300 meters west in 60 seconds. • What is his average velocity? • What is his average speed?
example • Sally gets up one morning and decides to take a three mile walk. She completes the first mile in 8.0 minutes, the second mile in 8.5 minutes, and the third mile in 9.0 minutes. What is her average speed?
example • In a drill during basketball practice, a player runs the length of the 30.-meter court and back. The player does this three times in 60. seconds. What is the average speed of the player during the drill?
example • The physics teacher walks 4 meters East, 2 meters South, 4 meters West, and finally 2 meters North. The entire motion lasted for 24 seconds. Determine the average speed and the average velocity. her average speed was 0.50 m/s and her average velocity of 0 m/s.
example • Use the diagram to determine the average speed and the average velocity of the skier during these three minutes. The skier has an average speed of (420 m) / (3 min) = 140 m/min and an average velocity of (140 m, right) / (3 min) = 46.7 m/min, right
example • What is the coach's average speed and average velocity? The coach has an average speed of (95 yd) / (10 min) = 9.5 yd/min and an average velocity of (55 yd, left) / (10 min) = 5.5 yd/min, left
Average Speed vs. Instantaneous Speed Average speed is a measure of the distance traveled in a given period of time; Suppose that during your trip to school, you traveled a distance of 5 miles and the trip lasted 0.2 hours (12 minutes). The average speed of your car could be determined as Instantaneous Speed - the speed at any given instant in time. For example, your speedometer tells the instantaneous speed. During your trip, there may have been times that you were stopped and other times that your speedometer was reading 50 miles per hour. Yet, on average, you were moving with a speed of 25 miles per hour.
Constant speed vs. changing speed An object with a changing speed would be moving a different distance each second. The data tables below depict objects with constant and changing speed. Constant speed: the object will cover the same distance every regular interval of time
In conclusion • Speed and velocity are kinematics quantities that have distinctly different definitions. Speed, being a _______quantity, is the rate at which an object covers ___________. The average speed is the _____________ (a scalar quantity) per time ratio. Speed is ignorant of direction. On the other hand, velocity is a _________quantity; it is direction-aware. Velocity is the rate at which the position changes. The average velocity is the ______________ or position change (a vector quantity) per time ratio. scalar distance distance vector displacement
Acceleration • Definition: how fast the velocity is changing - change in VELOCITY over TIME • Change in speed (speed up or slow down) • Change in direction • Equation: • VECTOR • measured in velocity unit / time unit (m/s2, mi/hr, etc.) ∆ (delta) means change ∆v = vf - vi
Anytime an object's velocity is changing, the object is said to be accelerating; it has an acceleration In a car, there are three controls that can create acceleration: gas petal, brake, steering wheel. According to the data, the velocity is changing over the course of time. In fact, the velocity is changing by a constant amount - 10 m/s - in each second of time. This is a case of constant acceleration.
The Meaning of Constant Acceleration • constant acceleration is when an accelerating object will change its velocity by the same amount each second. Acceleration is constant Acceleration is changing Do not confuse constant velocity with constant acceleration
Example Monty the Monkey accelerates uniformly from rest to a velocity of 9 m/s in a time span of 3 seconds. Calculate Monty's acceleration. A child riding a bicycle at 15 meters per second accelerates at −3.0 meters per second2 for 4.0 seconds. What is the child’s speed at the end of this 4.0-second interval?
The Direction of the Acceleration Vector • The direction of the acceleration vector depends on whether the object is speeding up or slowing down or changing directions. • If an object is speeding up, then its acceleration is in the same direction of its motion. • If an object is slowing down, then its acceleration is in the opposite direction of its motion. • If an object is traveling east initially (vi), then goes west (vf), its acceleration is west (same as vf) Positive accelerations don't necessarily indicate an object speeding up, and negative accelerations don't necessarily indicate an object slowing down.
Example • The instant before a batter hits a 0.14-kilogram baseball, the velocity of the ball is 45 meters per second west. The instant after the batter hits the ball, the ball’s velocity is 35 meters per second east. The bat and ball are in contact for 1.0 × 10⁻² second. Determine the magnitude and direction of the average acceleration of the baseball while it is in contact with the bat. vi = 45 m/s W vf = 35 m/s E t = 2.0x10⁻² s If East is + Then vi = -45 m/s, vf = +35 m/s East
2. Describing Motion with Diagrams • Know how to interpret motion using Ticker Tape Diagrams • Know how to interpret motion using Vector Diagrams
Ticker Tape Diagrams • A common way of analyzing the motion of objects in physics labs is to perform a ticker tape analysis. A long tape is attached to a moving object and threaded through a device that places a tick upon the tape at regular intervals of time - say every 0.10 second. As the object moves, it drags the tape through the "ticker," thus leaving a trail of dots. The trail of dots provides a history of the object's motion and therefore a representation of the object's motion.
Example • Oil drips at 0.4 seconds intervals from a car that has an oil leak. Which pattern best represents the spacing of oil drops as the car accelerates uniformly from rest? • . . . . . . . • . . . . • . . . . . . . • . . . . . . . . .
Example • A spark timer is used to record the position of a lab cart accelerating uniformly from rest. Each 0.10 second, the timer marks a dot on a recording tape to indicate the position of the cart at that instant, as shown. • The linear measurement between t = 0 second to t = 0.30 is 5.4 cm. • Calculate the average speed of the cart during the time interval t = 0 second to t = 0.30 second.
Vector Diagrams • Vector diagrams are diagrams that depict the direction and relative size of a vector quantity by a vector arrow. Constant acceleration Both velocity and acceleration change
3. Describing Motion with d-t Graphs • Understand The Meaning of Slope for a d-t Graph • Know The Meaning of Shape for a d-t Graph • Be able to Determine the Slope on a d-t Graph
The Meaning of Slope for a d-t Graph The slope of the line on a d-t graph is equal to the speed/velocity of the object. Distance or displacement
Slope is speed/velocity in a d-t Graph +4 m/s • If the object is moving with a velocity of +4 m/s, then the slope of the line will be ______. If the object is moving with a velocity of -8 m/s, then the slope of the line will be _______. If the object has a velocity of 0 m/s, then the slope of the line will be ________. -8 m/s 0 m/s
The Meaning of Shape for a d-t Graph As the slope goes, so goes the velocity Distance or displacement Distance or displacement Slope is Constant, positive, velocity is constant, positive or speed is constant Slope is increasing, positive, velocity is increasing, positive or speed is increasing. There is acceleration
As the slope goes, so goes the velocity Slow, Positive, Constant Velocity Fast, Positive, Constant Velocity displacement displacement Fast, Negative, Constant Velocity displacement displacement Slow, Negative Constant Velocity
As the slope goes, so goes the velocity displacement displacement Slope is negative, increasing (steeper) Slope is negative, decreasing (flatter) velocity is negative, increasing (faster in negative direction) velocity is negative, decreasing (slower in negative direction)
Check Your Understanding • Use the principle of slope to describe the motion of the objects depicted by the two plots below. displacement displacement velocity is positive, increasing (faster in positive direction) velocity is negative, increasing (faster in negative direction)
example displacement Describe the velocity of the object between 0-5 s and between 5-10 s. The velocity is positive constant between 0-5 seconds The velocity is zero between 5-10 seconds
example A cart travels with a constant nonzero acceleration along a straight line. Which graph best represents the relationship between the distance the cart travels and time of travel? A B C D
example • Which graph best represents the motion of a block accelerating uniformly down an inclined plane?
example • The displacement-time graph below represents the motion of a cart initially moving forward along a straight line. During which interval is the cart moving forward at constant speed?
Determining the Slope on a d-t Graph Displacement (m) • Pick two points on the line and determine their coordinates. • Determine the difference in y-coordinates of these two points (rise). • Determine the difference in x-coordinates for these two points (run). • Divide the difference in y-coordinates by the difference in x-coordinates (rise/run or slope). • Make sure all your work has units.
example Slope = -3.0 m/s
example • Determine the velocity (i.e., slope) of the object as portrayed by the graph below. The velocity (i.e., slope) is 4 m/s.
example • With the given d-t graph of Tom, • describe his motion during 0-5 s, 5-10 s, 10-12.5 s. • What is Tom’s total displacement in 12.5 seconds?
example • The graph represents the relationship between distance and time for an object. What is the instantaneous speed of the object at t = 5.0 seconds?
example • The graph below represents the displacement of an object moving in a straight line as a function of time. What was the total distance traveled by the object during the 10.0-second time interval?
4. Describing Motion with v-t Graphs • Know The Meaning of Slope for a v-t Graph • Be able to describe motion with given the Shape for a v-t Graph • Be able to Determining the Slope on a v-t Graph • Be able to Relate the Shape of d-t graph to the shape of v-t graph • Know the meaning of the Area on a v-t Graph • Be able to determine the Area on a v-t Graph