Download
1 / 28
280 likes | 284 Views
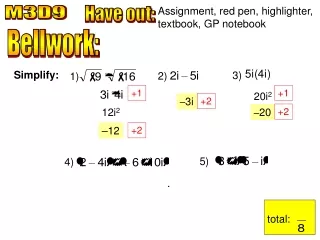
pencil, red pen, highlighter, GP notebook, graphing calculator. Have out:. M3M8D5. Bellwork:. Given the data set {3, 3, 5, 9}, determine the standard deviation by hand. Don’t use the “shortcut” on a calculator (but you may check your answer afterwards).

E N D
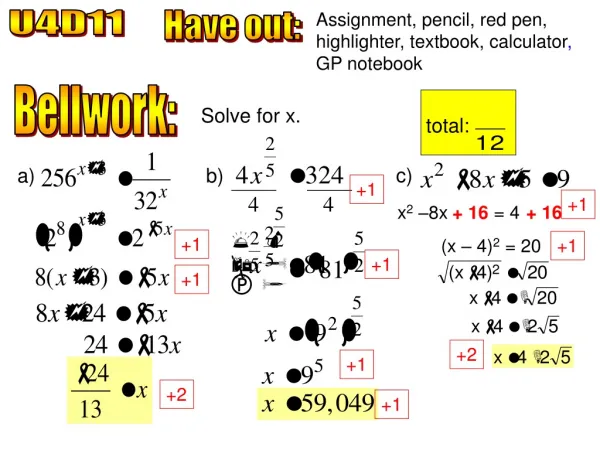
pencil, red pen, highlighter, GP notebook, graphing calculator Have out: M3M8D5 Bellwork: Given the data set {3, 3, 5, 9}, determine the standard deviation by hand. Don’t use the “shortcut” on a calculator (but you may check your answer afterwards).
Recall the steps for standard deviation: 1) mean 2) difference between data and mean 4 3 2 3) square the differences 4) sum of the squares 1 5) average the squares 6) square roots the average (variance) 6 5
{3, 3, 5, 9} 4 3 2 + 1 = 5 1 5 6 + 1 + 1 + 2 + 1 + 1
5–Number Summary and Box & Whisker Plots Example #1: The following are scores on a math test: 55, 74, 83, 91, 78, 64, 81, 94, 74, 79, 80, 71 Rewrite the scores in ascending order: _________________________________________________. 55, 64, 71, 74, 74, 78, 79, 80, 81, 83, 91, 94 Since there are 12 data points, the median is the average between _____ th and _____ th points. 7 6 = 78.5 Median = ______
percentile 50th The median is also called the ______ __________ because it is larger than ______% of the data. 50 n In general, the nth Percentile is larger than ____% of the data. The entire data set can be split into four equal-sized groups called ___________. quartiles Q1 Q2 quartiles Q3 ___, ___, and ___ are the dividing points between the ________. 81 55 83 91 ___ ___ ___ / ___ ___ ___ / ___ ___ ___ / ___ ___ ___ 64 71 74 94 74 78 79 80 Q2 Q3 Q1 78 + 79 Q2 = _______ Q3 = _______ Q1 = _______ = 78.5 2 MEDIAN
81 55 83 91 ___ ___ ___ / ___ ___ ___ / ___ ___ ___ / ___ ___ ___ 64 71 74 94 74 78 79 80 Q2 Q3 Q1 81 + 83 78 + 79 71 + 74 Q2 = _______ Q3 = _______ Q1 = _______ = 82 = 78.5 = 72.5 2 2 2 MEDIAN 25 Q1 is the _____th Percentile. It is the median of the bottom half of the data. In the example above, take the average between the _____ rd and _____th points to determine Q1. 3 4 75 Q3 is the _____th Percentile. It is the median of the top half of the data. In the example above, take the average between the _____ th and _____th points to determine Q3. 9 10 Basically, compute the median (3 times).
For any data set, the 5–Number Summary is: Write out the 5–Number Summary for the math scores. 72.5 82 55 78.5 94
box whisker We use the 5–# Summary to make a ____ and ________ Plot. 72.5 82 55 78.5 94 Step 1: Create a scale covering the smallest to largest values. Step 2: Plot the data points from the 5–Number Summary above the line. Step 3: Draw a rectangle beginning at Q1 and ending at Q3. Draw a line segment in the box representing Q2, the median. Step 4: Draw whiskers from each quartile to the extreme value data points. Q2 Q3 Q1 min max Score 100 50 60 70 90 80
50% The “box” represents the middle _______ of the data. The whiskers represent the ________ and ________ quartiles. upper lower 3 3 Q2 Q3 Q1 min max 3 tests 3 tests Score 100 50 60 70 90 80 Notice that the box and whiskers are not equal in size. Why? There are 3 tests in each quarter, so each quarter has the same amount of data. However, they are not spread out equally. For example the range of tests in the first quartile is from 55 to 71. However, the range of tests in the second quartile is from 74 to 78. The data is less spread out that the first quartile, hence, a smaller looking quartile.
Make a Box and Whisker Plot on a Calculator While I’m pulling up my calculator on the computer, put the data for the previous problem in the L1 column.
Practice: Refer back to our ¼ mile times data (in seconds): {58, 102, 65, 70, 68, 75, 81, 84, 79, 68}. Rewrite the times in ascending order: _______________________________________________. 58, 65, 68, 68, 70, 75, 79, 81, 84, 102 Find the 5–number summary. 58 68 72.5 81 102 Make and label a box plot. 68 72.5 81 58 102 60 70 80 90 100 110
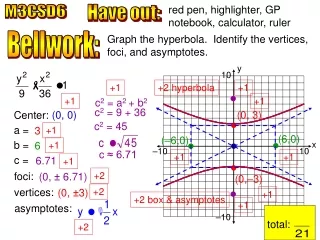
Interquartile Range spread Recall that standard deviation is a measure of _________ about the ______. Another measure of spread, which measures spread about the ________ is the _________________, the ________. mean interquartile range median IQR Q3 Q1 The IQR is defined as ____ - ____. For the ¼ mile times, IQR = ____ - ____ = ____ The IQR is the width of the ______, the middle ______ of the data, for a box and whiskers plot. 81 13 68 box 50%
Make a box and whiskers plot on the calculator of the ¼ mile times. 2nd STAT PLOT 1: PLOT 1… ON ENTER ON ENTER Select the second type. Arrow to the second box and hit Make sure that “X list:” is L1 and “Freq:” is 1 as illustrated above. ZOOM 9: ZOOM STAT Select Since we chose the 2nd type of box, the outliers are not determined. TRACE Select and use the left and right arrow keys to locate the 5–Number Summary.
TRACE Select and use the left and right arrow keys to locate the 5–Number Summary. 68 72.5 81 58 102 1st quartile 4th quartile 3rd quartile 2nd quartile 60 70 80 90 100 110 Note: there are the same number of points in each quartile, but the spread is variable 2 If a data point is more than __ standard deviations from X (mean), it is an outlier. There is also a way to determine outliers using the IQR.
1.5 IQR Criterion 19.5 For the data in the previous problem, IQR = __ and 1.5 IQR = __ If a data point is ______ than 1.5 IQRs _______ Q3, it is an ______ outlier. 13 more above upper Example #5: Find the cutoff for the upper outliers for this data. Fill in the data from the 5–number summary. 58 68 72.5 81 102 81 19.5 100.5 81 Q3 = ____ Q3 + 1.5 IQR = _____ + _____ = _____ 102 Since student # 2 had a time of 102 seconds, and ____ > 100.5, 102 is an _______ _______. upper outlier less below If a data point is ______ than 1.5 IQRs _______ Q1, it is a ______ outlier. lower
Example #6: Find the cutoff for the lower outliers for this data. Q1 = ____ Q1 – 1.5 IQR = ______ – ______ = ______ Since there are no points below _________ seconds, there are ________ lower outliers. 48.5 68 68 19.5 48.5 no Explanation… Modified Box and Whiskers Plot To modify the box and whiskers plot for outliers, we show outliers as _________, and only extend the whiskers as far as any data point that is ________ an outlier. dots not To make a modified box and whiskers plot, do the following: 2nd STAT PLOT 1: PLOT 1… ON ENTER ON Select the FIRST type, which shows the box and whisker plot with dots. Arrow to the FIRST box and hit ENTER
1.5(IQR) 1.5(IQR) outliers outliers IQR Q1 Q3
TRACE Select and use the left and right arrow keys to locate the 5–Number Summary to help you make the box plot. 68 72.5 81 58 84 102 60 70 80 90 100 110
Summary: Over the last several days, we have discussed three measures of spread: • Range measures the spread from the minimum to the maximum value. • Standard deviation measures spread of the data about the _________. mean median 3. IQR measures spread about the __________. (resistant to outliers)
Assignment # 5: Day 5 Worksheet DS 95 and 98
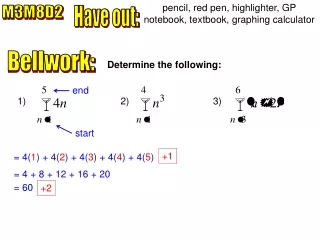
pencil, red pen, highlighter, GP notebook, graphing calculator total: Have out: 4/20/11 Bellwork: Given 2 data sets {3, 3, 5, 9} and {4, 5, 5, 10}, answer the following for each data set: a) sketch a histogram. b) find the average. c) determine the standard deviation by hand. Don’t use the “shortcut” on a calculator (but you may check your answer afterwards). d) which data set is more “spread out” from the mean?
Frequency 3 2 1 data 0 0 3 5 4 6 7 9 8 Frequency 3 2 1 data 0 0 4 6 5 7 8 10 9 + 1 {3, 3, 5, 9} + 1 + 1 labeled axes + 1 bars {4, 5, 5, 10} +1 + 1 + 1 labeled axes + 1 bars
Recall the steps for standard deviation: 1) mean 2) difference between data and mean 4 3 2 3) square the differences 4) sum of the squares 1 5) average the squares 6) square roots the average (variance) 6 5
{3, 3, 5, 9} 4 3 2 1 + 2 5 6 + 2 + 1 + 1
{4, 5, 5, 10} 4 3 2 1 + 2 5 6 + 2 + 1 + 1
Frequency 3 2 1 data 0 0 3 5 4 6 7 9 8 Frequency 3 2 1 data total: 0 0 4 6 5 7 8 10 9 {3, 3, 5, 9} The data from {3, 3, 5, 9} is more spread out from the mean. + 1 {4, 5, 5, 10}
Practice: Answer the following using this data {46, 41, 32, 27, 50, 38, 40, 29, 31, 47, 42, 30} a) Rewrite the data in ascending order: 27, 29, 30, 31, 32, 38, 40, 41, 42, 46, 47, 50 Q2 Q3 Q1 b) Determine the 5–Number Summary and IQR. Show all work! 42 + 46 38 + 40 30 + 31 Q2 = _______ Q3 = _______ Q1 = _______ = 44 = 39 = 30.5 2 2 2 MEDIAN 30.5 44 27 39 50
30.5 44 27 39 50 Q2 Q3 Q1 min max 50 20 30 40