Download

1 / 23
230 likes | 344 Views
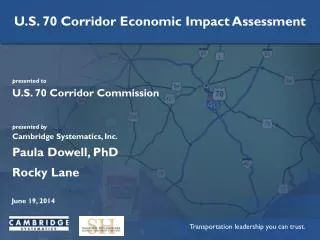
U.S. 70 Corridor Economic Impact Assessment. U.S. 70 Corridor Commission. June 19, 2014. Paula Dowell, PhD Rocky Lane. Agenda. Economic Development Analysis. Input into Analysis. Interviews Counties Municipalities Utilities Regional Economic Development Organizations Focus Groups

E N D
U.S. 70 Corridor Economic Impact Assessment U.S. 70 Corridor Commission June 19, 2014 Paula Dowell, PhD Rocky Lane
Input into Analysis • Interviews • Counties • Municipalities • Utilities • Regional Economic Development Organizations • Focus Groups • Data Research
Importance and Current Conditions of US 70 • Varies widely from West to East • Critically Important for Communities Along 70 • Rated 5 on a 1-5 Scale with 5 being the highest • Description • “Our Main Street” • “The Main East-West Artery” • “The Only Way In or Out • “We Live and Die by What Happens on 70”
Economic Development Implications • All major employers located within two (2) miles • Lenoir County • DuPont – 70 Trucks/Day going to I-95 • 500 Trucks/Day in/out of the main Industrial Park • Thousands of Jobs within ¼ mile of the US 70 Centerline-Kinston • A factor in most plant expansion decision • Completion of the Bypass system improves competitive position • Raw materials in/Finished goods out • Expansion of labor pool
Lost Projects in the Region • Existing Company Expansions • Big Rock Sports • US 70 Conditions – not the key, but a contributing factor • Lost 160 Jobs – 80 remain • New Locations • Boeing-Access to I-95 • Gatorade-Access to I-95 • Boat Builder
Implications for Port and Global TransPark • Completion from I-95 to Port rated “High” • Benefits to Port and Counties • Improve Quality of Port Projects • Open sites for Port Users • Connectivity to I-95 - “Very Important” • Global TransPark • Enhances GTP’s prospects • Potentially opens sites and parks in other Corridor counties • Necessary but not sufficient
Military • Importance Rated at 4 Out of 5 • Connectivity to I-95 – “Very Important” • Primary corridor for delivery of mission critical elements - aircraft fuel & parts • Primary corridor for personnel going to the Washington, DC area • US 70 is not critical to fulfillment of mission • Deployment – Non-Issue • BRAC – Non-Issue • Key Issues – Logistics & commuting related
Summary • Economic Profile - solid and healthy • Facing Challenges - Not all could be solved with completion of Bypass system • Improvements benefit all sectors of economic development • Improvements benefit not only the corridor but all of North Carolina
Methodology • Based on NCDOT forecasts • Individual bypass studies • Stakeholder input • Key Assumptions • Traffic projections completed at bypass level and not corridor level • Growth adjusted based on planned development, e.g., 6,000 jobs at GTP in 2040
Impact Categories Direct User Impacts Business Competitiveness EconomicImpacts Travel time Vehicle operating costs Safety cost Reliability Traffic volumes Productivity Market access Business costs GDP Employment Income
Economic Impact of Not Completing US 70 2014 - 2040 Source: Cambridge Systematics analysis using the REMI economic model. ( ) denotes negative values
Economic Impact of Completing US 70 2014 - 2040 Source: Cambridge Systematics analysis using the REMI economic model. ( ) denotes negative values
Market Access Analysis and Induced Economic Development • Economic development assessment • Stakeholder input • Site analysis • Gap analysis • I-40 Corridor • US 64 Corridor
Summary Findings Source: Cambridge Systematics analysis using the REMI economic model. ( ) denotes negative values
Key Takeaways • No build results in slower economic growth • 340 fewer jobs per year and $800 million less in GRPbetween 2014 and 2040 • Completing US 70 results in $56 million in business cost savings for existing users, $1.2 billion in GRPbetween 2014 – 2040 • Increasing efficiency, accessibility and connectivity translates into 1,150 to 1,900 additional jobs per year along U.S. 70 • In total, the upgrading the entire U.S. 70 corridor could give rise to an additional 1,150 to 1,900 jobs along the corridor and up to 2,500 jobs per year statewide