Download
1 / 1
10 likes | 70 Views
Factors ranged from 0.88 (Southeast in August) to 1.15 (Northwest in August) and were similar for both parity groups. Correlations among ME milk calculated from unadjusted TD using SLC and RSLC were > 0.999 in all cases.

E N D
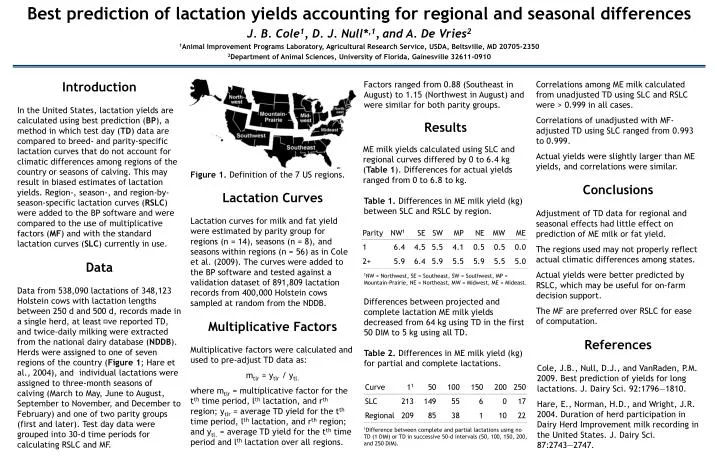
Factors ranged from 0.88 (Southeast in August) to 1.15 (Northwest in August) and were similar for both parity groups. Correlations among ME milk calculated from unadjusted TD using SLC and RSLC were > 0.999 in all cases. Correlations of unadjusted with MF-adjusted TD using SLC ranged from 0.993 to 0.999. Actual yields were slightly larger than ME yields, and correlations were similar. Introduction In the United States, lactation yields are calculated using best prediction (BP), a method in which test day (TD) data are compared to breed- and parity-specific lactation curves that do not account for climatic differences among regions of the country or seasons of calving. This may result in biased estimates of lactation yields. Region-, season-, and region-by-season-specific lactation curves (RSLC) were added to the BP software and were compared to the use of multiplicative factors (MF) and with the standard lactation curves (SLC) currently in use. Results ME milk yields calculated using SLC and regional curves differed by 0 to 6.4 kg (Table 1). Differences for actual yields ranged from 0 to 6.8 to kg. Figure 1. Definition of the 7 US regions. Conclusions Lactation Curves Table 1. Differences in ME milk yield (kg) between SLC and RSLC by region. Adjustment of TD data for regional and seasonal effects had little effect on prediction of ME milk or fat yield. The regions used may not properly reflect actual climatic differences among states. Actual yields were better predicted by RSLC, which may be useful for on-farm decision support. The MF are preferred over RSLC for ease of computation. Lactation curves for milk and fat yield were estimated by parity group for regions (n = 14), seasons (n = 8), and seasons within regions (n = 56) as in Cole et al. (2009). The curves were added to the BP software and tested against a validation dataset of 891,809 lactation records from 400,000 Holstein cows sampled at random from the NDDB. Data 1NW = Northwest, SE = Southeast, SW = Southwest, MP = Mountain-Prairie, NE = Northeast, MW = Midwest, ME = Mideast. Data from 538,090 lactations of 348,123 Holstein cows with lactation lengths between 250 d and 500 d, records made in a single herd, at least ve reported TD, and twice-daily milking were extracted from the national dairy database (NDDB). Herds were assigned to one of seven regions of the country (Figure 1; Hare et al., 2004), and individual lactations were assigned to three-month seasons of calving (March to May, June to August, September to November, and December to February) and one of two parity groups (first and later). Test day data were grouped into 30-d time periods for calculating RSLC and MF. Differences between projected and complete lactation ME milk yields decreased from 64 kg using TD in the first 50 DIM to 5 kg using all TD. Multiplicative Factors References Multiplicative factors were calculated and used to pre-adjust TD data as: mtlr = ytlr / ytl. where mtlr = multiplicative factor for the tth time period, lth lactation, and rth region; ytlr = average TD yield for the tth time period, lth lactation, and rth region; and ytl. = average TD yield for the tth time period and lth lactation over all regions. Table 2. Differences in ME milk yield (kg) for partial and complete lactations. Cole, J.B., Null, D.J., and VanRaden, P.M. 2009. Best prediction of yields for long lactations. J. Dairy Sci. 92:1796―1810. Hare, E., Norman, H.D., and Wright, J.R. 2004. Duration of herd participation in Dairy Herd Improvement milk recording in the United States. J. Dairy Sci. 87:2743―2747. 1Difference between complete and partial lactations using no TD (1 DIM) or TD in successive 50-d intervals (50, 100, 150, 200, and 250 DIM).