Download

1 / 26
300 likes | 789 Views
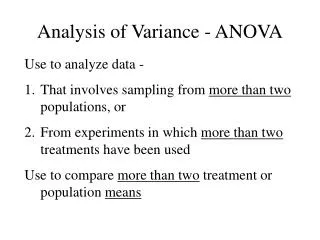
ANOVA: A Test of Analysis of Variance. By Harry Lee and Manik Kuchroo. What is the ANOVA Test?. Remember the 2-Mean T-Test? For example: A salesman in car sales wants to find the difference between two types of cars in terms of mileage: Mid-Size Vehicles Sports Utility Vehicles.

E N D
ANOVA: A Test of Analysis of Variance By Harry Lee and Manik Kuchroo
What is the ANOVA Test? Remember the 2-Mean T-Test? For example: A salesman in car sales wants to find the difference between two types of cars in terms of mileage: Mid-Size Vehicles Sports Utility Vehicles
Car Salesman’s Sample The salesman took an independent SRS from each population of vehicles: LevelnMeanStDev Mid-size 28 27.101 mpg 2.629 mpg SUV 26 20.423 mpg 2.914 mpg If a 2-Mean TTest were done on this data: T = 8.15 P-value = ~0
What if the salesman wanted to compare another type of car, Pickup Trucks in addition to the SUV’s and Mid-size vehicles? LevelnMeanStDev Midsize 28 27.101 mpg 2.629 mpg SUV 26 20.423 mpg 2.914 mpg Pickup 8 23.125 mpg 2.588 mpg
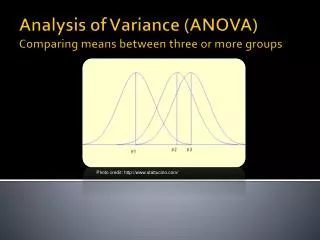
This is an example of when we would use the ANOVA Test. In a 2-Mean TTest, we see if the difference between the 2 sample means is significant. The ANOVA is used to compare multiple means, and see if the difference between multiple sample means is significant.
Let’s Compare the Means… Yes, we see that no two of these confidence intervals overlap, therefore the means are significantly different. This is the question that the ANOVA test answers mathematically. Do these sample means look significantly different from each other?
More Confidence Intervals What if the confidence intervals were different? Would these confidence intervals be significantly different? Significant Not Significant
ANOVA Test Hypotheses H0: µ1 = µ2 = µ3 (All of the means are equal) HA: Not all of the means are equal For Our Example: H0: µMid-size = µSUV = µPickup The mean mileages of Mid-size vehicles, Sports Utility Vehicles, and Pickup trucks are all equal. HA: Not all of the mean mileages of Mid-size vehicles, Sports Utility Vehicles, and Pickup trucks are equal.
F Statistic Like any other test, the ANOVA test has its own test statistic The statistic for ANOVA is called the F statistic, which we get from the F Test The F statistic takes into consideration: number of samples taken (I) samplesize of each sample (n1,n2, …, nI) means of the samples ( 1, 2, …, I) standard deviations of each sample (s1, s2, …, sI)
Explaining the F-Statistic • The F statistic determines if the variation between sample means is significant This is what we are doing when we look at the 95% confidence intervals.
Another Look at the CI’s From this picture, we can see that the variation between sample means is greater than the variation in each sample; therefore, F is large.
F Statistic Equation Rewritten as a formula, the F Statistic looks like this: Means (Squared) Weighing Weighing Standard Deviations (Squared)
Degrees of Freedom The ANOVA test has 2 degrees of freedom: N-I (Total number sampled – Number of Groups) I-1 (Number of Groups – 1) Some sample distributions with different degrees of freedom:
How About Our Example: Data: LevelnMeanStDev Midsize 28 27.101 mpg 2.629 mpg SUV 26 20.423 mpg 2.914 mpg Pickup 8 23.125 mpg 2.588 mpg F value = 40.05 P-value = ~0 (Found from a table or using the Fcdf calculator command).
Conditions As useful as the ANOVA test is, we can only use it if a number of conditions are met: We must take an independent SRS from each population that we sample All populations have the same standard deviation. (No population’s standard deviation is double another’s) All of the populations must be normally distributed
Testing the Conditions The salesman had originally taken independent SRS’s. The second condition is fulfilled since no sample has more than twice the standard deviation of any other. To test the third condition, whether the populations being sampled are normally shaped, we must look at the histograms of each sample:
Sample Histograms All of the histograms appear to be relatively normally shaped. Therefore, all of the conditions are fulfilled.
Try a Problem Researchers are trying to see if the English AP scores from four different Massachusetts private schools are different. From each school, a random sample of students in the past year was taken and compared. Here are the results from the samples:
Results SchoolnMeanStDev BB&N 23 4.3 0.4 Roxbury Latin 25 3.9 0.6 Winsor 26 4.2 0.3 Belmont Hill 29 3.1 0.3 Is there any significant difference between these schools’ AP English scores? (Assume that the populations are normally distributed)
Hypotheses • H0: = µBB&N µRL = µWinsor = µBelHill The mean AP English Test scores in BB&N, Roxbury Latin, Winsor, and Belmont Hill are all the same. • HA: The mean AP English Test scores in BB&N, Roxbury Latin, Winsor, and Belmont Hill are not all the same.
Conditions • Random samples taken • All of the standard deviations are the same • No standard deviation is more than twice any other. • All of the populations are normally distributed
F Curve • Plug the F statistic into the F distribution (df = 3, 99). The shaded area has a p-value of nearly 0.
Interpretation Since all the conditions were met, we have conclusive evidence (df = 3,99, p = 0) to reject the null hypothesis that the mean AP English Test scores in BB&N, Roxbury Latin, Winsor, and Belmont Hill are all the same.
Thanks For Watching • A special thanks to Mr. Coons for all the help and advice.