Download
1 / 25
250 likes | 362 Views
Student Debt Overview. NCHER Legislative Conference September 26, 2013 Meta Brown, Federal Reserve Bank of New York. The views presented here are those of the author and do not necessarily reflect those of the Federal Reserve Bank of New York, or the Federal Reserve System.

E N D
Student Debt Overview NCHER Legislative Conference September 26, 2013 Meta Brown, Federal Reserve Bank of New York • The views presented here are those of the author and do not necessarily reflect those of the Federal Reserve Bank of New York, or the Federal Reserve System
Recent Household Balance Sheet Developments • FRBNY’s 2013Q2 Household Debt and Credit Report was released in mid-August. • Student debt grew by $8 billion (0.8 ppt) to $994 billion. • This is a slower rate of growth than 2012Q4 – 2013Q1 (2.1 ppt), but similar to 2012Q1-2012Q2 (1.1 ppt). In general, Q1-Q2 is a slower growth period for (credit reporting of) student debt. • Overall consumer debt fell by $79 billion, or 0.7 ppt, to $11.15 trillion. (Peak $12.68 trillion) • Housing debt fell: Mortgage -$92 billion (1.1 ppt – transfer of servicing); HELOC -$12 billion (2.2 ppt) • Non-housing debt rose: SL; Credit card +$8 billion (1.2 ppt); Auto +$20 billion (2.5 ppt)
Higher Education and Student Debt • Higher education is crucial to improving the skill level of American workers, especially given rising income and employment gaps between high school and college graduates. • With growing enrollment and rising tuition, student loans play an increasingly important role in financing higher education. • Rapid growth in the prevalence of student borrowing, and aggregate student debt balances approaching $1 trillion, have attracted attention from policymakers, the media, and the public. • We describe the historical and current situation of student debt and discuss its implications for borrowers and the economy.
Data: FRBNY Consumer Credit Panel (CCP) / Equifax • The findings discussed here are based on the FRBNY Consumer Credit Panel (CCP) – a representative sample of consumer credit data that the New York Fed acquired from Equifax. • The CCP contains borrower-level information on student loan balances and payment status, along with other types of household debt – but no federal vs. private student loan distinction. • Details are available in Donghoon Lee’s press briefing, available via • http://www.newyorkfed.org/regional/householdcredit.html • Lee, Wilbert van der Klaauw, Joelle Scally, Andrew Haughwout, and David Yun regularly update information on student loan borrowers and related household debt on our public website. • http://www.newyorkfed.org/householdcredit
Total student loan balances by age groupincreasing across all age groups Source: FRBNY Consumer Credit Panel / Equifax
Non-mortgage balances Source: FRBNY Consumer Credit Panel / Equifax Student debt is the only kind of household debt that continued to rise through the Great Recession. Now the second largest balance after mortgage debt.
Number of borrowers and average balance per person Each increased by 70% between 2004 and 2012 (7% per year) Source: FRBNY Consumer Credit Panel / Equifax
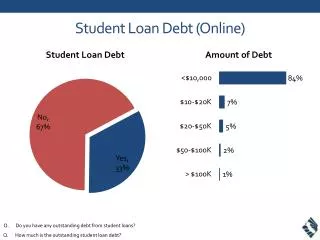
Distribution of student loan balance, 2012:Q4 40% of borrowers have balances less than $10,0003.7% of borrowers have balances greater than $100,000 Source: FRBNY Consumer Credit Panel / Equifax
Student borrowing increasingly prevalent Source: FRBNY Consumer Credit Panel / Equifax
Share of borrowers 90+ days delinquent (incl. default) Source: FRBNY Consumer Credit Panel / Equifax 6.7 million borrowers, or 17%, are 90+ days delinquent. 30-49 year olds have higher delinquency rates.
Borrower repayment status, 2012:Q4 About 44% of borrowers are not yet in active repayment due to deferments and forbearances. Another way to look at the delinquency rate is to consider only those in active repayment and remove those who are not in repayment from the denominator… * Repayment status is defined using the quarterly change in balance and the current payment status. Source: FRBNY Consumer Credit Panel / Equifax
Delinquency rates higher among borrowers in repayment Source: FRBNY Consumer Credit Panel / Equifax
Young student borrowers retreat from housing marketwith coauthor Sydnee Caldwell Source: FRBNY Consumer Credit Panel / Equifax
Young student borrowers retreat from auto market Source: FRBNY Consumer Credit Panel / Equifax
Student borrowing increasingly prevalent Source: FRBNY Consumer Credit Panel / Equifax
Student borrowers deleverage, despite rapid SL growth Source: FRBNY Consumer Credit Panel / Equifax
Why the decline in housing & auto market participation? • Weakened labor markets Lowers graduates’ expectations regarding future income Graduates reign in consumption • Decreased access to credit • Underwriting standards tightened in the recession & recovery • DTI calculations include larger student loan balances • Increased SL delinquency lowers apparent creditworthiness Consider trends in credit scores for those with and without student debt:
Declining relative credit scores of student borrowers Source: FRBNY Consumer Credit Panel / Equifax
Conclusion • Higher education is an important investment among young workers, but it is accompanied with a growing student debt burden. • Aggregate student loan balances almost tripled between 2004 and 2012 due to an increasing number of borrowers and higher balances per borrower. • About 17% of borrowers are delinquent on student debt. Adjusting for repayment causes the delinquency rate to rise to over 30%.
Conclusion • Young student borrowers appear to have retreated from both housing and auto markets between 2008 and 2012. • Hence, despite rapidly growing student debt balances, they lowered their overall debt from 2008 to 2012. • Lowered earning expectations, tighter underwriting standards, higher DTIs, and decreased creditworthiness may limit the contribution of these skilled young workers to housing and auto market recoveries. While highly skilled young workers have traditionally provided a vital influx of new, affluent consumers to U.S. housing and auto markets, unprecedented student debt may dampen their influence in today’s marketplace.
Appendix: www.newyorkfed.org/householdcredit • On our website, we provide: • Updates of our Quarterly Report on Household Debt & Credit • Balances for Mortgages, Credit Card, Auto, & Student Debt • Delinquency rates • Spreadsheets: • All data featured in the Quarterly Report on Household Debt & Credit (1999-2013:q1, quarterly) • Student loan • # borrowers, delinquency rates, average balance • By state (2004-2012, annual) • By age group (2012 only)