Download
1 / 36
360 likes | 606 Views
Modelling TIRF Microscopy Data of Dynamic Microtubules at Super-Resolution. Summer Project Results Nils Gustafsson Supervised By: Dr Lewis Griffin Dr Thomas Surrey. Summary. Microtubules Microtubules and the Cytoskeleton Analysis of Microtubule Growth

E N D
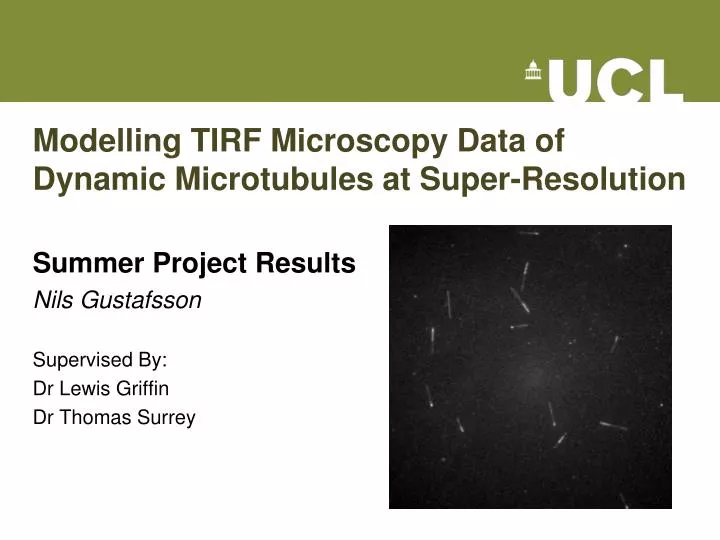
Modelling TIRF Microscopy Data of Dynamic Microtubules at Super-Resolution Summer Project Results Nils Gustafsson Supervised By: Dr Lewis Griffin Dr Thomas Surrey
Summary • Microtubules • Microtubules and the Cytoskeleton • Analysis of Microtubule Growth • Modelling of Vitro Microtubule Experiments • “Gaussian Rendering” Approach • Validation of In Vitro Experiments • Accuracy and Precision of End Tracking • Labelling Ratio • Labelling Ratio With Noise • Experimental Conditions • Conclusions
Microtubules and the Cytoskeleton Multiple Cellular Functions • Mechanical Stability • Scaffold Structures • Force Generation • Cargo Transport • Cell Migration • Cell Differentiation • Cell Division Drug Targets • Vinca Alkaloids • Taxanes Microtubules (green) DNA (blue) EB1 (yellow) Fig. (top right) The Dixit Lab research webpage, Washington University Fig. (bottom right) taken from Torsten Wittmann homepage, UCSF
Labelling Ratio Response of the accuracy to labelling ratio is non-linear
Labelling ratio in a 1D Toy Model Error in the mean of a cumulative Gaussian fit to a 1D toy model of an imaged microtubule shows that the response of the accuracy to labelling ratio is non-linear
Labelling Ratio and SNR Precision is clustered into three groups proportional to SNR value
Experimental Conditions Precision is clustered into two groups proportional to SNR value Best Case Axial accuracy <5nm Axial precision <42nm Lateral precision <1nm Lateral precision <14nm
Conclusions • A new dynamic microtubule TIRF data simulator has been created • True representation of nanoscale structure • Easy manipulation of orientation and MT bending • Computationally efficient • The accuracy and precision of a microtubule end tracking algorithm has been characterised • Best case axial accuracy is <5nm • Best case axial precision is <42nm • A modification to mean squared displacement theory has been derived in order to make use of the empirically derived accuracy of the end tracking
Acknowledgements Microtubule Cytoskeleton Lab, Cancer Research UK • Dr Thomas Surrey Laboratory Head • Dr Nicholas Cade Principal Scientific Officer • Dr Iris Lueke Senior Scientific Officer • Ms Claire Thomas Senior Scientific Officer • Dr Sebastian Maurer Previous Group Member • Dr Christian Duellberg Scientific Officer • Dr Jayant Asthana Research Fellow • Dr Todd Fallesen Research Fellow • Dr Franck Fourniol Research Fellow • Dr Johanna Roostalu Research Fellow • Dr Einat Schnur Research Fellow • Dr Hella Baumann Graduate Student • Mr Jonathon Hannabuss Graduate Student • Ms Rupam Jha Graduate Student • Mr Gergo Bohner Diploma Student CoMPLEX, UCL • Dr Lewis Griffin • Ms Stephanie Reynolds
Modelling of Microtubule Dynamics • Accurate quantification of experiment leads to improved models • Models should include: • Growth velocities and fluctuations • Interaction with MAPs • Catastrophe/rescue frequencies Fig. (left) modified from Gardner et. al. Cell, 2011 Fig. (right) modified from Maurer, Cade, Bohner et. al. Current Biology, 2014
Analysis of In Vitro Experiments • Custom analysis software tracks end positions • Using convolved model fitting • Sub-pixel precision alignment of frames allows averaged intensity profiles to be produced • Multiple channels can be analysed including MAP structures
Dynamic Instability Fig. taken from C. Conde & A. Caceres, Nature reviews Neuroscience, 2009
Dynamic Instability • Microtubule (+)end tracking proteins (green) reveal rapid growth and shrinkage episodes in live cells. • Fine control of microtubule dynamics by microtubule associated proteins (MAPs). Fig. (bottom left) taken from Molecular Cell Biology 4th ed, Lodish
Simulating Experimental Data • Monte-Carlo Simulation of the 1D model defines a state sequence used to reconstruct microscope images • Considerations: 200-2000 states per frame, noise, movement, labelling densities, magnification…… Fig. (center left) modified from Gardner et. al. Cell, 2011
Validation of In Vitro Experiment Analysis • Simple simulations have previously been used to determine resolution of taper lengths • We would like to be able to determine accuracy of tracking of dynamic characteristics of microtubule growth – such as growth fluctuations. Fig. (bottom left) modified from Maurer, Cade, Bohner et. al. Current Biology, 2014
Microtubules and the Cytoskeleton Multiple Cellular Functions • Mechanical Stability • Scaffold Structures • Force Generation • Cargo Transport • Cell Migration • Cell Differentiation • Cell Division Drug Targets • Vinca Alkaloids • Taxanes Microtubules (green) DNA (blue) EB1 (yellow) Fig. (top right) taken from Molecular Cell Biology 4th ed, Lodish Fig. (bottom right) taken from Torsten Wittmann homepage, UCSF
In Vitro Microtubule Experiments • Stabilised GMPCPP seeds are bound to a cover slip • Fluorescently tagged tubulin subunits are introduced via micro-fluidics • Microtubules are nucleated at the seeds • Imaged by TIRF microscopy as they grow Fig. (bottom left) taken from C Duellberg’s PhD Thesis Fig. (bottom right) taken from The Dixit Lab research webpage, Washington University