Download
1 / 36

E N D
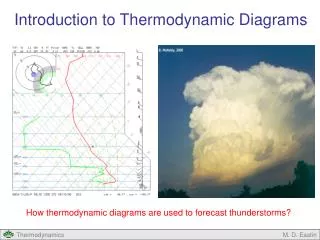
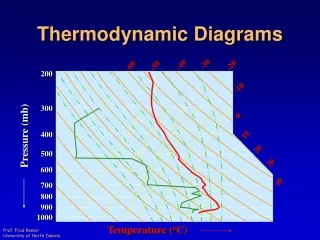
*** THERMODYNAMIC DIAGRAMS *** GENERAL INTRODUCTION: Thermodynamic (also called adiabatic or aerological) diagrams of various types are in use, and the earliest dates from the late 19th century. They are all, however, based on the same principles, and differences are mainly in appearance. Each chart contains five sets of lines: isobars, isotherms, dry adiabats, pseudo-adiabats & saturation moisture lines. The calculations are based on the basic laws of thermodynamics and temperature-pressure-humidity relationships, that can be accomplished very quickly. The diagrams are such that equal area represents equal energy on any point on the diagram: this simplifies calculation of energy and height variables too when needed. For basic calculation such as condensation level, temperature of free convection, it will be enough to understand what the various sets of lines mean, and more importantly, how to use them.
*** THERMODYNAMIC DIAGRAMS ***Page-2 Contd… • There are four/five such diagrams called : • the Emagram • the Tephigram • the SkewT/Log P diagram (modified emagram) • the Psuedoadiabatic (or Stüve) diagram • ** The emagram was devised in 1884 by H. Hertz. In this plot, the dry adiabatic lines have an angle of about 45degrees with the isobars; isopleths of saturation mixing ratio are almost straight and vertical. In 1947, N. Herlofson proposed a modification to the emagram which allows straight, horizontal isobars, and provides for a large angle between isotherms and dry adiabats, similar to that in the tephigram. • ** The Tephigram takes its name from the rectangular Cartesian coordinates : temperature and entropy. The Greek letter 'phi' was used for entropy, hence Te-phi-gram (or T-F-gram). The diagram was developed by Sir William Napier Shaw, a British meteorologist about 1922 or 1923, and was officially adopted by the International Commission for the Exploration of the Upper Air in 1925.
*** THERMODYNAMIC DIAGRAMS ***Page-3 Contd… ** The Stüve diagram was developed circa 1927 by G. Stüve and gained widespread acceptance in the United States: it uses straight lines for the three primary variables, pressure, temperature and potential temperature. In doing so we sacrifices the equal-area requirements (from the original Clapeyron diagram) that are satisfied in the other two diagrams. ** The SkewT/Log(-P) diagram is also in widespread use in North America, and in many services with which the United States (various) weather services have had connections. This is in fact a variation on the original Emagram, which was first devised in 1884 by H. Hertz.
*** THERMODYNAMIC DIAGRAMS *** • the Emagram • the Tephigram • the SkewT/Log P diagram (modified emagram) • the Psuedoadiabatic (or Stüve) diagram
Review of Fundamentals of Thermodynamic Objective: To find some useful relations among air temperature, volume, and pressure. Review Ideal Gas Law: PV = nRT Pα = RdT = R’T First Law of Thermodynamics: d’q = du + d’w W = ∫ pdα
Review (cont.) Definition of heat capacity: cv = du/dT = Δu/ΔT cp = cv + R Reformulation of first law for unit mass of an ideal gas: d’q = cvdT + pdα d’q = cpdT − αdp
Review (cont.) For an isobaric process: d’q = cpdT For an isothermal process: d’q = − αdp = pdα = d’w For an isosteric process: d’q = cvdT = du For an adiabatic process: cvdT = − pdαand cpdT = αdp
Review (cont.) For an adiabatic process: cvdT = − pdαand cpdT = αdp du = d’w (T/T0) = (p/p0)K Where K = R/cp = 0.286 (T/θ) = (p/1000)K Define potential temperature: θ = T(1000/p)K • Potential temperature, θ, is a conserved quantity in an adiabatic process.
Review (cont.) definition of φ as entropy. dφ ≡ d’q/T ∮ dφ = 0 Entropy is a state variable. Δφ = cpln(θ/θ0) In a dry adiabatic process potential temperature doesn’t change, thus entropy is conserved.
Isobars and Isotherms The pressure and temperature uniquely define the thermodynamic state of an air parcel (an imaginary balloon) of unit mass at any time.. The horizontal lines representisobars and the vertical lines describe isotherms.
Dry Adiabatic Lines These lines represent the change in temperature that an unsaturated air parcel would undergo if moved up and down in the atmosphere and allowed to expand or become compressed (in a dry adiabatic process) because of the air pressure change in the vertical.
Pseudo or Wet Adiabatic Lines These curves portray the temperature changes that occur upon a saturated air parcel when vertically displaced. Saturation adiabats appear on the thermodynamic diagram as a set of curves with slopes ranging from 0.2C°/100 m in warm air near the surface to that approaching the dry adiabats (1C°/100 m) in cold air aloft.
Isohume – Mixing Ratio Lines These lines (also called saturation mixing ratio lines) uniquely define the maximum amount of water vapor that could be held in the atmosphere (saturation mixing ratio) for each combination of temperature and pressure. These lines can be used to determine whether the parcel were saturated or not.
*** Emagram *** isotherms isobars The emagram was devised in 1884 by H. Hertz. In this the dry adiabats make an angle of about 45degrees with the isobars; isopleths of saturation mixing ratio are almost straight and vertical. In 1947, N. Herlofson proposed a modification to the emagram which allows straight, horizontal isobars, and provides for a large angle between isotherms and dry adiabats. An area on emagram denotes total work done in a cyclic process Energy-per-unit-mass-diagram ∮w = -R’∮ T dlnP R’lnP T T A true thermodynamic diagram has AreaaEnergy
*** SkewT-LogP diagram*** ** The SkewT/Log(-P) diagram is also in widespread use in North America, and in many services with which the United States (various) weather services have had connections. This is in fact a variation on the original Emagram, which was first devised in 1884 by H. Hertz. y = -RlnP x = T + klnP k is adjusted to make the angle between isotherms and dry adiabats nearly 90o.
lnP T Dry adiabats ***Tephigram*** ** The Tephigram takes its name from the rectangular Cartesian coordinates : temperature and entropy. Entropy is usually denoted by capital letter S, but in earlier texts, the Greek letter 'phi' was used, hence Te-phi-gram (or T-F-gram). The diagram was developed by Sir William Napier Shaw, a British meteorologist about 1922 or 1923, and was officially adopted by the International Commission for the Exploration of the Upper Air in 1925. An area in the Tephigram denotes total HEAT/ENERGY added to a cyclic process ∮d’q = ∮ T d φ = cp∮ Tdθ /θ = cp∮ Td (lnθ)
The tephigram • Allows a radiosonde profile to be analysed for stability • Allows calculations involving moisture content (e.g. saturated adiabatic lapse rate) to be performed graphically • Is confusing at first sight!
Basic idea • Plot temperature as x-axis and entropy as y • dS = cpdlnθ so we plot temperature versus lnθ
Adding pressure Our measurements are of temperature and pressure, so we want to represent pressure on the plot. The curved lines are isopleths of constant pressure, in mb.
Adding Moisture information • Dew point is a measure of moisture content. The tephigram can be used to convert (TD,T) to mixing ratio • Mass mixing ratio isopleths are light dashed lines. Units are g kg-1 • Curved lines are saturated adiabats – the path a saturated parcel of air follows on adiabatic ascent
Rotating plot and plotting profile The diagram is rotated through 45° so that the pressure lines are quasi-horizontal Temperature and Dew point are plotted on the diagram. Dew point is simply plotted as a temperature. Here:
The Tephigram Saturated adiabatic ConstantMixing ratio
Example 1 Tropopause Inversion layer Saturated air (T = TD)
Example 2 Tropopause Frontal Inversion layer
*** Stüve diagram *** ** The Stüve diagram uses straight lines for the three primary variables, pressure, temperature and potential temperature. In doing so we sacrifices the equal-area requirements (from the original Clapeyron diagram) that are satisfied in the other two diagrams. For an adiabatic process: θ = T (1000/p)K The Stüve diagram is also simply called adiabatic chart