Download
1 / 41
450 likes | 754 Views
Water Pollution. G. Tyler Miller ’ s Living in the Environment 13 th Edition Chapter 19. What is water pollution?. Any chemical, biological, or physical change in water quality that has a harmful effect on living organisms or makes water unsuitable for desired uses. Major C ategories.

E N D
Water Pollution G. Tyler Miller’s Living in the Environment 13th Edition Chapter 19
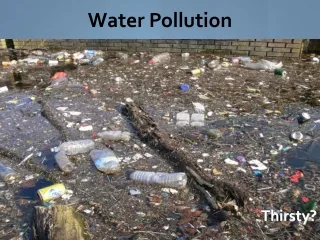
What is water pollution? Any chemical, biological, or physical change in water quality that has a harmful effect on living organisms or makes water unsuitable for desired uses.
Major Categories Infectious Agents Oxygen-Demanding Wastes Inorganic Chemicals Organic Chemicals Plant Nutrients Sediment Radioactive Material Heat (Thermal Pollution) Review Table 19.1!!
Common Diseases Transmitted Through Contaminated Drinking Water
Effects of Yuck Water Premature death of 3.4 million people worldwide each year Diarrhea alone kills 2.1 million people
How do we measure water quality? Presence or Absence of Harmful Pollutants Concentration of Harmful Pollutants Drinking water 0 colonies per 100 ml Swimming water 200 colonies per 100 ml HUMAN CONSUMPTION RECREATION Fecal Coliform Test
How do we measure water quality? Measuring the level of Dissolved Oxygen (DO) Fig. 19-3 p. 485
How do we measure water quality? Using DO + BOD measurements Using chemical analysis Presence/Absence and concentration Using indicator species macroinvertebrates
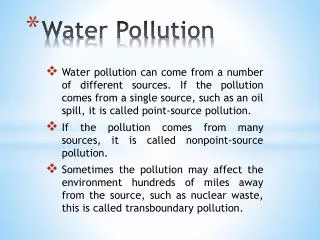
Sources of Water Pollution Point Sources Discharge of pollutants at specific locations through pipes, ditches, or sewers into bodies of surface water. Easier to control Non-Point Sources pollutants cannot be traced to any single source of discharge, diffuse sources Difficult to control
Point and Nonpoint Sources NONPOINT SOURCES Rural homes Cropland Urban streets Animal feedlot POINT SOURCES Suburban development Factory Wastewater treatment plant Fig. 19-4 p. 486
Pollution of Streams • DO + BOD Relationships Fig. 19-5 p. 488
Pollution of Lakes Slow turnover Flushing and changing of water temp Thermal stratification Little vertical mixing Biological Magnification Increase in the concentration of chemicals in organisms at successively higher trophic levels of a food chain Eutrophication Natural nutrient enrichment of lakes
Water 0.000002 ppm Phytoplankton 0.0025 ppm Herring gull 124 ppm Herring gull eggs 124 ppm Zooplankton 0.123ppm Lake trout 4.83 ppm Rainbow smelt 1.04 ppm Biomagnification
1. Eutrophication – enrichment of a body of water by inorganic plant and algal nutrients • Creates an environmental problems as: • excess nutrients enter water system • increases photosynthetic productivity • numbers of algae and cyanobacteria increase • water become cloudy (turbid) from population increase • populations die off and sink to bottom • become food for decomposers • decomposers BOD but DO in waters • fish die off • other species take root in nutrient rich sediments and begin to fill in waters • Lake said to be eutrophic! • Cultural or artificial eutrophication can occur as nutrient levels are increased from sewage or agricultural runoff into waterways!
Pollution of Lakes Fig. 19-7 p. 491 • Cultural Eutrophication
Oligotrophic Waters Oligotrophic waters – have minimal levels of nutrients, unenriched, clear waters, small populations of aquatic organisms
Reducing Surface Water Pollution Nonpoint Sources Point Sources • Reduce runoff • Clean Water Act • Buffer zone vegetation • Water Quality Act • Reduce soil erosion
POLLUTION OF GROUNDWATER It can take hundreds to thousand of years for contaminated groundwater to cleanse itself ofdegradable wastes. Nondegradable wastes(toxic lead, arsenic, fluoride) are there permanently. Slowly degradable wastes(such as DDT) are there for decades.
Groundwater Pollution: Sources Hazardous waste injection well Pesticides Coal strip mine runoff De-icing road salt Buried gasoline and solvent tank Cesspool septic tank Pumping well Gasoline station Waste lagoon Water pumping well Sewer Landfill Leakage from faulty casing Accidental spills Discharge Unconfined freshwater aquifer Confined aquifer Confined freshwater aquifer Groundwater flow
Leaking tank Aquifer Bedrock Water table Groundwater flow Free gasoline dissolves in groundwater (dissolved phase) Gasoline leakage plume (liquid phase) Migrating vapor phase Water well Contaminant plume moves with the groundwater Fig. 21-8, p. 502
Groundwater Pollution Prevention Monitoring aquifers Leak detection systems Strictly regulating hazardous waste disposal Storing hazardous waste materials above ground
Sewage Treatment Septic tanks and various levels of sewage treatment can reduce point-source water pollution.
Sewage Treatment Raw sewage reaching a municipal sewage treatment plant typically undergoes: Primary sewage treatment: a physicalprocess that uses screens and a grit tank to remove large floating objects and allows settling. Secondary sewage treatment: a biologicalprocess in which aerobic bacteria remove as much as 90% of dissolved and biodegradable, oxygen demanding organic wastes.
Sewage Treatment Primary and Secondary sewage treatment.
Primary Secondary Chlorine disinfection tank Bar screen Grit chamber Settling tank Aeration tank Settling tank To river, lake, or ocean Sludge Raw sewage from sewers (kills bacteria) Activated sludge Air pump Sludge digester Disposed of in landfill or ocean or applied to cropland, pasture, or rangeland Sludge drying bed Fig. 21-16, p. 511
Primary Treatment PRIMARY removes suspended/floating particle screening and settling Material removed called primary sludge
Secondary Treatment • SECONDARY microorganisms decompose suspended organic material • trickling filters = water flows through aerated rock beds with bacteria to degrade organic material • activated sludge process = aerated and circulated water with bacteria is allowed to settle out creating secondary sludge • NOW FREE OF SEWAGE!
Sewage Treatment Advanced or tertiary sewage treatment: Uses series of chemical and physical processes to remove specific pollutants left (especially nitrates and phosphates). Water is chlorinated to remove coloration and to kill disease-carrying bacteria and some viruses (disinfect). TERTIARYbio/chem/phy process that removes dissolved minerals (N & P), metals, viruses, organic cmpds
Sludge Disposal Options • Anaerobic digestion (need space and time) • Convert to Fertilizer (Town of Cary) • Incineration (Carbon dioxide emissions – ash disposal harmful) • Ocean Dumping – BAN in 1988/1991 • Landfill Disposal
Technological Approach: Advanced Sewage Treatment • Removes specific pollutants Fig. 19-18p. 505
DRINKING WATER QUALITY Centralized water treatment plants and watershed protection can provide safe drinking water for city dwellers in developed countries. Simpler and cheaper ways can be used to purify drinking water for developing countries. Exposing water to heat and the sun’s UV rays for 3 hours can kill infectious microbes.
2 million plastic bottles,dumped every 5 minutes. Is Bottled Water the Answer?
Is Bottled Water the Answer? Some bottled water is not as pure as tap water and costs much more. 1.4 million metric tons of plastic bottles are thrown away. Fossil fuels are used to make plastic bottles. The oil used to produce plastic bottles in the U.S. each year would fuel 100,000 cars.
Safe Drinking Water Act (1974) • set uniform standards for drinking water across US • states had various standards prior to this date • EPA determined MCLs (maximum contaminant levels) • EPA oversees program • Amended 1986 & 1996 • 1996 Amendment required disclosure to citizens of contaminants in water
CLEAN WATER ACT (1977) Amended 1981 & 1987 • formerly known as Water Pollution Control Act TWO MAIN GOALS • eliminate discharge of pollutants • attain water quality for safe fishing and swimming • CWA effective at improving water quality at point sources • Point source discharges must obtain NPDES permits • (National Pollutant Discharge Elimination System) to release untreated wastewater into waterways • Nonpoint Source discharges very difficult to control • 1987 NPDES permit needed for nonpoint source discharges • CWA not as effective at monitoring these discharges due to lack of cooperation/coordination between govt, citizens, and industry
CLEAN WATER ACT • CWA effective at improving water quality at point sources • Point source discharges must obtain NPDES permits • (National Pollutant Discharge Elimination System) to release untreated wastewater into waterways • Nonpoint Source discharges very difficult to control • 1987 NPDES permit needed for nonpoint source discharges • CWA not as effective at monitoring these discharges due to lack of cooperation/coordination between govt, citizens, and industry
CLEAN WATER ACT • 1987 NPDES permit needed for nonpoint source discharges • CWA not as effective at monitoring these discharges due to lack of cooperation/coordination between govt, citizens, and industry