Download
1 / 14
260 likes | 551 Views
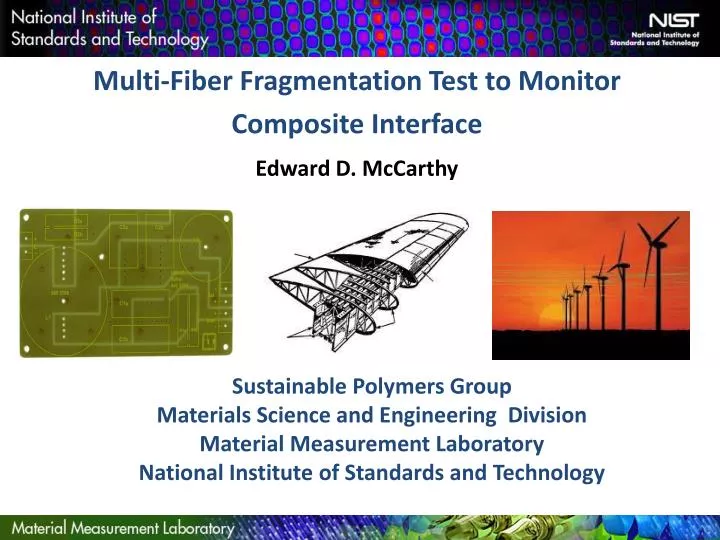
Multi-Fiber Fragmentation Test to Monitor Composite Interface Edward D. McCarthy. Sustainable Polymers Group Materials Science and Engineering Division Material Measurement Laboratory National Institute of Standards and Technology. Acknowledgements.

E N D
Multi-Fiber Fragmentation Test to Monitor Composite Interface Edward D. McCarthy Sustainable Polymers Group Materials Science and Engineering Division Material Measurement Laboratory National Institute of Standards and Technology
Acknowledgements Fragmentation (Polymer Division, now MSED) Jae Hyun Kim Gale A. Holmes Statistics (Statistical Services Division) Alan Heckert Stefan D. Leigh Composites Project (Polymer Division, now MSED) Mauro Zammarano, (Engineering Laboratory) Jeffrey W. Gilman
Composites in Aircraft • Increasing substitution of fiber-reinforced polymer composites (FRPC) in aircraft, (carbon and glass fibers) • Composites already included in key functional locations, (e.g. wings, tail) e.g. Boeing Aircraft 787 and 777 (below) • Effort to lightweight and conserve fuel while maintaining or improving existing safety and performance. Surface Modelling for Composite Materials - SIAG GD - Retrieved at http://www.ifi.uio.no/siag/problems/grandine/
Composites in Aircraft a) b) c) • Many modes of composite failure. • Various scenarios involve one layer of fibers. • Many testing protocols employ tension to model failure behavior (right). • Micromechanics uses uni-axial testing such as single and multi-fiber-fragmentation to study matrix-fiber interface d) • Common testing configurations: • compact tension • (b) four-point bend • (c) double edge notched tension • (e) centre notched tension
Objectives Matrix Fiber dfiber ~15 μm Matrix Four parts to the project: Visualize failure modes during multi-fiber failure. Analyse formation of breaks and their location distribution in-situ during strain, (fragmentation) Study stress transfer between fibers at various times during strain Calculate interfacial shear stress = Interphase = Interface
Multi-Fiber Fragmentation Test Part I: Specimen Preparation • Multiple Fibers laid into silicone dogbone mold and tensioned. • Two at either extremes of sprue entrance, (blue light), four in the middle forming a central array or bundle. • Measurements taken digitally to one tenth of a micron. • Fiber position and alignment monitored, (left).
Multi-Fiber Fragmentation Test Part II: Sample Testing • Load cell recordsforce history on dogbone specimen while strain recorded by gauge • Strain-controlled Force applied every10 minutes or 1 hover a total of 350 minutes or 35 h, (Applied machine rate: 0.85 mm / s or 0.85 % / s > strain period of 0.35 s • Photographs of central fiber bundle scanned quickly towards end of each 10 minute or 1 h period. Tensile / imaging apparatus • Debond images analysed statistically: (N.A. Heckert, S. Leigh, Statistical Services Division, NIST). • Strain / stress data used to calculate ISS and other metrics such as critical fiber length, matrix-radius etc.
Multi-Fiber Fragmentation Test Part II: Sample Testing Unstrained specimen, no breaks Strained specimen, with breaks • Whole specimen strained in increments to a critical or saturated strain. • Measurements of break locations, (black areas), their number density and the break lengths taken at each increment. • Break locations correlated statistically between fibers • To determine any stress transfer in a direction approximately transverse to fiber-array axis, (i.e. are the breaks lining up across fibers to statistical significance?) • Measurements used to calculate interfacial shear stress, critical fiber length and matrix radius-of-influence.
Multi-Fiber Fragmentation Test Part III: Image Analysis, Data Fitting • Break centroids on each image are manually identified in Digimizer software • This data is then used to calculate real break centroid locations and lengths on a micron scale • The data is sent for statistical analysis; i.e. for fitting by various statistical distributions. • The break length and strength distributions calculated may be used to estimate interfacial shear strength using statistical correlations developed by Phoenix et al. among others. Figure 2: Array of fibers after straining showing breaks (black) Figure 1: Array of fibers in tough matrix, (high strain-to-failure) prior to straining
Multi-Fiber Fragmentation Test Part IV: Data Fitting: Uniform v. Weibull Single Fiber: 10 minute test; Three alternative distribution fits 2 parameter Weibull 3 parameter Weibull Uniform Distribution • Two-parameter, three-parameter and uniform distributions were applied to data from a single fiber test. • While all show qualitative agreement with the data, the uniform distribution returns consistently higher values of correlation coefficient. • This strongly suggests that the break centroid distribution for the single fiber is statistically better represented as a uniform distribution.
Multi-Fiber Fragmentation Test Part V: Data Fitting: Trends Six-Fiber Bundle: 10 minute test; Time appearance of fragments • Sets of fresh breaks are marked in red at each testing interval. • In some cases, clear trend of transverse spread of breaks perpendicular to fiber axis. • Effectively demonstrates the concept of stress transfer or “cross-talk” between fibers. • Basis for examining literature models of stress transfer i.e. rm parameter.
Multi-Fiber Fragmentation Test VI. Calculation of IFSS from Distributions Interfacial shear stress defined by this force balance • Local interfacial shear stress can be calculated by knowing applied stress and strain over known strain increment. • Stress / break distribution over length of fiber can be used in the calculation.
Multi-Fiber Fragmentation Test VI. Calculation of IFSS from Distributions Need an approach to evaluate this term, i.e. the distribution of stress along the axis of the fiber. 1 Derivative can be approximated by the ratio of mean fiber strength over critical length (σf/lc) (as stress plateaus over lc) 2 • Estimates for all parameters can be improved by fitting actual MFFT fiber break data using Weibull distributions Weibull model links strength distribution to fragment length l 3 Local Fiber stress as function of length and Weibull scale σ0 and shape m parameters, (Wagner et al.) 4 Critical fragment length as function of Weibull scale σ and shape m parameters, (Drzal et al.) 5
MFFT Summary • Single-fiber fragmentation in uni-axial tension developed for calculation of IFSS using various models and visual evaluation of fiber break formation. • Here, SFFT extended to multi-fiber arrays (enhanced multi-fiber fragmentation test MFFT), to interrogate stress transfer from fiber to fiber. • Spatial break centroid distribution shown to be more Uniform than either 2- or 3-parameter Weibull in nature, (higher correlation coefficients). • This continues original observation of Holmes et al. 2007 for single fiber. • Also strong correlation of break spatial-distributions between fibers. • Time-evolution of breaks shows clear linear transverse distribution across fiber bundle axis > facilitates study of stress concentration / transfer. • Improved modeling of spatial break and strength distributions should improve calculations for IFSS and inform better design process.