Download
1 / 9
90 likes | 96 Views
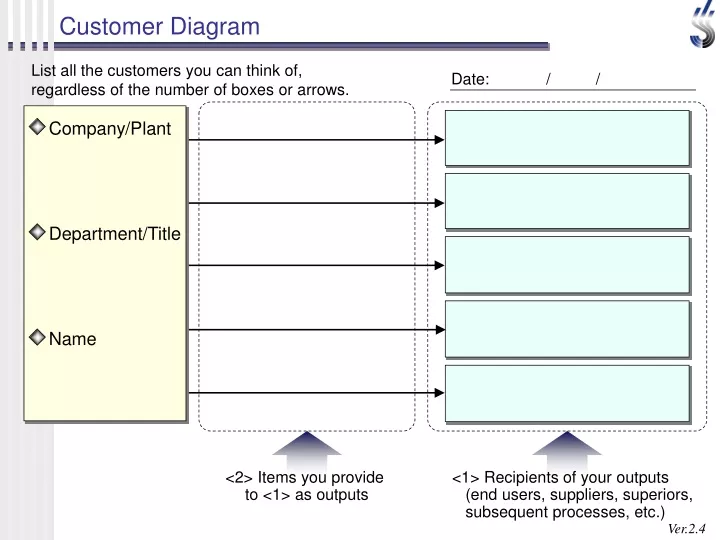
Customer Diagram. List all the customers you can think of, regardless of the number of boxes or arrows. Date: / /. Company/Plant. Department/Title. Name. <2> Items you provide to <1> as outputs. <1> Recipients of your outputs (end users, suppliers, superiors,

E N D
Customer Diagram List all the customers you can think of, regardless of the number of boxes or arrows. Date: / / Company/Plant Department/Title Name <2> Items you provide to <1> as outputs <1> Recipients of your outputs (end users, suppliers, superiors, subsequent processes, etc.)
Define Diagram 2. Commitment to Your Process (tentative) 1. Customer and VOC Customer Department NameDate// Customer Requirements with Voice Commitment (in plain language understandable to the customer) Basic Requirements without Voice Subconscious Expectation VOC
Commitment CE Diagram Department: Name: Date: / / Enter all necessary items, regardless of the number of boxes or lines. Draw a CE diagram for each commitment listed in the define diagram Customer V O C Present
QFD Chart Department: Written by: Date: Describe your position QFD Chart Weight Total points Rate each item: 9 points (highly applicable), 3 points (fairly applicable), or 1 point (barely applicable). Note: To prevent the above items from being selected intentionally, multiply the weighting factors later at once.
CTQ Diagram - A (If the CTQ Does Not Require Breakdown) Department: Name: Date: / / What To What Extent When to achieve Person In Charge CTQ1 CTQ2 CTQ3 CTQ4 CTQ5 CTQ6 CTQ7 CTQ8
Department: Name: Date: / / CTQ Diagram - B (If the CTQ Requires Breakdown) CTQ (primary) CTQ (secondary) When to achieve What To What Extent Person In Charge * Connect each primary CTQ item to the corresponding secondary CTQ items with black solid lines with black arrowheads.
Department: Name: Date: / / Defining CTQ CTQ The key to the success of the project is to determine "to what extent." 1. Who is the customer of this CTQ? 2. What are the aim and purpose of the CTQ? (Value for Customer) What? What? In detail with five questions 3. What is the level you want to attain? What? What? In detail with five questions 4. How to measure the level? Do you have any good ideas? 5. What is the target value? (What is the current status?) Determine the target value based on the attained level What To What Extent When CTQ
RAS (Risk Analysis Sheet) Department: Name: Date: / / SEV POCC PRPN PSEV OCC RPN Execution Plan Preventive Action Item No Risk Factor Effect Causes
Dept.: CH Name: Date: / / BB Name: CH Approval Date / / CH Signature Project Purchase Order Sheet (PPO) STEP-2/14 STEP-2/14 STEP-3/14 CTQ Project Name Improvement Metrics What to achieve STEP-5/14 Current Values To what extent When to achieve STEP-5/14 Target Values STEP-5/14 STEP-5/14 STEP-5/14 PGS Schedule Project Members / / GB Gains+Savings: Define / / Measure Investment: / / Analyze -) / / Improve / / PGS Control