Download
1 / 55
550 likes | 557 Views
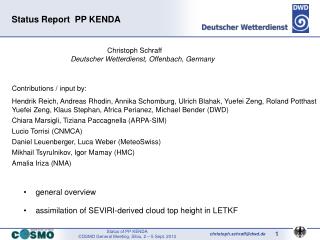
Status Report for KENDA-O (WG1). Christoph Schraff Deutscher Wetterdienst, Offenbach, Germany. Contributions / input by: Hendrik Reich, Andreas Rhodin, Roland Potthast, Klaus Stephan, Ulrich Blahak,

E N D
Status Report for KENDA-O (WG1) Christoph SchraffDeutscher Wetterdienst, Offenbach, Germany Contributions / input by: Hendrik Reich, Andreas Rhodin, Roland Potthast, Klaus Stephan, Ulrich Blahak, Michael Bender, Elisabeth Bauernschubert, Axel Seifert, Alberto de Lozar, Axel Hutt, … (DWD) Daniel Leuenberger, Daniel Regenass, Alexander Haefele (MeteoSwiss); Sylvain Robert (ETH) Chiara Marsigli, Virginia Poli, Thomas Gastaldo (ARPAE-SIMC) Lucio Torrisi, Francesca Marcucci, Valerio Cardinali, Paride Ferrante (COMET) Mikhail Tsyrulnikov, Dmitri Gayfulin (HMC)
KENDA-O overview • PP KENDA-O : Km-Scale Ensemble-Based Data Assimilation • for the use of High-Resolution Observations • (Sept. 2015 – Aug. 2020) • Task 1: further development of LETKF scheme • work towards operationalization: additive covariance inflation • limiter to soil moisture perturbations • (other tests: AMDAR RH, AMDAR bias correction, RTPS, …) • comparison of MCH and DWD KENDA • Task 2: extended use of observations • radar radial winds • Mode-S aircraft • Task 3: lower boundary: soil moisture analysis using satellite soil moisture data • Task 4: adaptation to ICON-LAM, hybrid methods / particle filters
operational use of KENDA • MeteoSwiss: KENDA operational for EPS • since 19 May 2016 (x = 2.2 km) • KENDA for det. COSMO-1: 2018 • (T,qv in PBL still worse, some problems) • DWD: KENDA operational for det. + EPS • since 21 March 2017 (x = 2.8km) • ARPAE-SIMC: KENDA operational for determ. forecast (Italy)since May 2017, for EPS soon (2.2 km) • COMET: KENDA code adapted to include • (Italy) required capabilities of COMET system • and run in a parallel suite (x = 10 km) • (still slightly worse than COMET code)
KENDA at DWD: KENDA-LETKF pre-operational setup KENDA: 4D-LETKF + LHN (latent heat nudging for assimilation of radar precip) benchmark: operational EPS (40 mem.) K: Kalman Gain for ensemble mean benchmark: operational Nudging + LHN (unperturbed) (pre-) operational settings ( Schraff et al. 2016, QJRMS) : • adaptive horizontal localisation(keep # obs constant, 50 km ≤ s ≈ std dev ≤ 100 km) • adaptive mutliplicative covariance inflation (obs-f.g. statistics) + RTPP (p = 0.75) • explicit soil moisture perturbations • conventional obs types only (radiosonde, aircraft, wind profiler, synop) 1 hour 1 hour
winter test KENDA vs. nudging: larger 2-m temperature cold bias • bug in model system setup: insufficient Grib precision in analysis for T_SO, leading to underestimation of melting of soil ice bug fixed in COSMO V5.04c , operational since mid-Nov. 2016 • „additive covariance inflation“: • additional perturbations in all LETKF analysis ensemble members, based on climatological forecast error covariances from global EnVar for ICON • purpose: account for model errors in a better way, so that 1-h forecast ensemble differences (covariances) provide a more complete description of the true errors of the 1-h forecast • increases ensemble spread, increases (error) space spanned by ensemble • increases weight of observations in analysis experiment: December 2016 (with low stratus periods: 03 – 09 Dec, 15 – 21 Dec, 29 Dec – 02 Jan)
additive covariance inflation using 3DVar-B (10 – 18 Feb. 2016) T bias T f.g. bias f.g. rmse ana bias ana rmse spread additive covariance inflation: • increases f.g. spread • draws analysis closer to obs • reduces low-level T rmse in f.g. • reduces low-level T, T2M bias ! • little effect on forecast errors (T, wind…)
winter experiment (Dec. 2016): KENDA vs Nudging, surface verification T2M RH2M PS bias KENDA with additive inflation nudging KENDA with additive inflation nudging std.dev. rmse
winter experiment (Dec. 2016) verification against radiosondes KENDA (additive infl.) vs. nudging RH wind dir. wind speed T
winter experiment: low stratus (cloud), 5 Dec. 2016, 12 UTC exp. 1001: additive infl. operational nudging (pre-oper.) std. KENDA 5 Dec 2016, 0 UTC + 12 h 5 Dec 2016, 12 UTC+ 0 h
winter experiment: vertical profiles, 50°/10°, 5 Dec. 2016, 12 UTC operational nudging (pre-oper.) std. KENDA exp. 1001: additive infl. T QV QC 5 Dec 2016, 12 UTC+ 0 h
Summary • additive inflation: • winter: large positive impact on low stratus + 2-m temperature bias very positive for EPS • summer (convective period) : minor mixed impact (possibly due to larger effect of soil moisture perturbations in summer) introduced in KENDA parallel suite on 8 Feb.
Summary • KENDA (with additive inflation) vs. operational nudging: deterministic forecasts: positive for convective precipitation in summer positive for 2-m temperature mixed for low stratus in winter negative for surface pressure in summer EPS: very positive (in summer & winter, for precip, wind gusts, …) operational introduction of KENDA: 21 March 2017 • but: pending issue, to be solved before summer
pre-operational KENDA suite at DWD in summer 2016: effect of soil moisture perturbations (SMP) 24 Aug. 2016 soil moisture layer 5, diff. betw. 2 mem. (1,8) T2m at noon, diff. betw. 2 mem. (1,8) 10 5 0 -5 -10 200 100 0 -100 standard soil moisture perturb.: T2m deviations of individual ensemble members unrealistically large in some situations 10 5 0 -5 -10 100 50 0 -50 test: soil moisture perturbations reduced by 50 % : T2m deviations realistic implement limiter to spread of soil moisture index (SMI) and assess impact on LETKF (spread)
description of new setup with limiter for soil moisture perturbations • current setup: soil moisture perturbations: = 0.072 SMI / day • modifications (for parallel suite) : • no explicit SM perturbations added where spread(SMI) > 0.15 “soft limiter” for SMP • explicit soil temperature (T_SO) perturbations: = 0.48 K / day depth weight of perturbations
soft limiter of soil moisture perturbations: impact on a sunny day (23 June 2016) soil level 2 : 1 – 3 cm soil level 5 : 27 – 81 cm spread of soil moisture index (14 UTC) original (Exp 10396) with SMP limiter (Exp 10416) • soft limiter: SMI spread limited to ~ 0.15 SMI
soft limiter of soil moisture perturbations: impact on a sunny day (23 June 2016) afternoon (14 UTC) Meteosat (12 UTC) spread of 2-m temperature original (Exp 10396) mid-level cloud (12 UTC) with SMP limiter (Exp 10416) • T_2M spread decreased mainly in sunny areas
soft limiter of soil moisture perturbations: impact on spread of T2M, day by day spread of 2-m temperature, time series of 0-UTC runs 26 May – 27 June 2016 afternoon (14 UTC) sunny day – 25 % reduction 5 – 25 % 1 – 25 June 2017 many sunny days reduction 10 – 35 % • T_2M spread reduction larger, due to sunny days, larger SMP (≤ 40%), drier soil (25%)
soft limiter of soil moisture perturbations: impact on spread of T2M, day by day spread of 2-m temperature, time series of 0-UTC runs 26 May – 27 June 2016 night (2 UTC) reduction ≤ 10 % 1 – 25 June 2017 reduction 5 – 18 % • T_2M spread reduction larger (as for soil temperature, effect from daytime?)
impact of SMP limiter on scores, deterministic: surface verification SMP limiter vs. original ps RH2M T2M 26 May – 27 June 2016 reduction of [%] of rmse ps RH2M T2M 1 – 25 June 2017 forecast lead time [h] • parallel suite: neutral (slightly better for RH2M in first 4 hours) neutral also in upper-air verif & precipverif
impact of SMP limiter on scores, EPS: surface verification (1 – 25 June 2017) spread T2M RH2M ps original SMP limiter RMSE CRPS reduction [%] of CRPS reduction [%] of CRPS reduction [%] of CRPS
impact of SMP limiter on scores, EPS: radiosonde verification (1 – 25 June 2017) reduction [%] of CRPS orig with SM limiter
impact of SMP limiter on scores, EPS: precip / radar verif. (26 May – 12 July 2016) 0-UTC runs 0.1 mm/h 1 mm/h 5 mm/h the lower the better Brier Score decomposition reliability: average agreement betw. fcst & obs val.; related to (cond.) bias original SMP limiter the higher the better resolution: ability of forecast to separate one type of outcome from another lead time [h] lead time [h] lead time [h] • slightly better reliability (except high threshold) + better resolution (not susceptible to calibration!)
impact of soft SMP limiter: summary • impact of reduced soil moisture perturbations on scores: • T_2M spread strongly reduced in sunny days as required • T_2M + RH_2M spread moderately reduced in general in June 2017 more than in June 2016, because in 2017: • more sunny days • original soil moisture perturbations larger • drier soil • deterministic scores: neutral • EPS: slightly (more) reduced (bias) errors (upper-air T, surface pressure), slightly improved resolution for precip • hypothesis: due to introduction of additive covariance inflation (in February), reduced soil moisture perturbations can be afforded or are even beneficial soft limiter to soil moisture perturbations operational since early July
Task 1: Further development of KENDA, operationalisation MeteoSwiss • stochastic physics (SPPT) + soil moisture perturbations (SMP) to increase ensemble spread (too low in PBL, mainly T + qv) • summer: consistent positive impact • winter: smaller positive impact on temperature, but mixed impact on humidity • fog + low stratus: mixed feedback by forecasters, sometimes very good, sometimes very bad • operational KENDA draws the analysis (clearly) less close to the observations compared to nudging (for COSMO-1 and COSMO-7) (without SPPT, SMP) introduced operationally in Feb. 2017 (for COSMO-E)
Comparison of MCH and DWD KENDA • at MCH, KENDA analyses + short-range forecasts still worse than those using nudging, particularly in winter • this was not seen for DWD implementations + 0 h + 12 h Sept. – Nov. 2016 standard deviation for temperature COSMO-1 nudging COSMO-E KENDA COSMO-7 nudging similar results for winter 2017 & spring (with SPPT, SMP) • why does KENDA at MCH not (seem to) give enough weight to radiosonde obs ?
Comparison of MCH and DWD KENDA MeteoSwiss analysis verification DWD verification + 0 h COSMO-1 nudging COSMO-E KENDA COSMO-7 nudging Winter 2016 Spring 2017 (without additive inflation)
Comparison of MCH and DWD KENDA • to understand possible causes, compare performance of MCH & DWD KENDA implem. • based on Radiosonde observations from Stuttgart, München& Payerne • for two periods: December 2016 , May 2017 Generally: Same LETKF configurations at MCH and DWD Differences of relevance are: generally: same LETKF configurations at MCH and DWD relevant differences :
Comparison of MCH and DWD KENDA Radiosonde data from Stuttgart, Munich & Payerne , for May 2017 (310 Radiosondes) without observation alignment in verification Temperature Relative Humidity Wind Speed RMSE Spread Spread corr. MCH DWD (“Spread corr” accounts for obs errors: (fg + o) )
Comparison of MCH and DWD KENDA Radiosonde data at p=925hPa from Stuttgart, Munich & Payerne , for May 2017 T RMSE Spread Spread corr. RMSE Spread Spread corr. RH MCH DWD FF MCH DWD 15. May 08. May 22. May 01. May 29. May
Comparison of MCH and DWD KENDA : findings • DWD and MCH KENDA First Guess RMSE comparable (MCH: larger RMSE of T, RH at lowest level) • MCH : spread slightly larger in T, FF (IFS LBC + SPPT vs. ICON LBC + additive infl.) • (T, RH) RMSE has higher time variations than spread • similar results for December 2016 period not yet understood why MCH KENDA performs worse than MCH nudging
Progress in KENDA-O: Task 2: Extended use of observations: ongoing • radar radial winds: DA exp., promising results • radar reflectivity: DA sensitivity tests, results mostly preliminary: ARPAE-SIMC (≤ 4 radars): 1h / 30’/ 15’ cycling, temporal thinning, RTPS, addit. infl. DWD: warm bubbles, remapping of Z for Gaussianity, 1.1km, 2-moment microphys. • GPS slant total delay: technical work incl. monitoring, in V5.04d, new DA exp. running (old exp: benefit on precip, elsewhere mixed (negative at low levels)) • SEVIRI WV: many (mostly clear-sky) sensitivity DA tests, inconclusive, no benefit yet • SEVIRI cloud top height: no resources • T2M, RH2M: delayed (resources at MCH in 2018) • Mode-S aircraft : DA exp., promising results • Raman lidar(T-, q- profiles): quality of Payerne T-obs improved, DA being set up • AMSU, ATMS, IASI clear-sky radiances: no resources • 3 new projects at DWD ( WG1): SEVIRI VIS, lightning, (nowcast) objects
Task 2, extended use of observations: Mode-S aircraft Mode-S aircraft • derived from radar data from air-traffic control, processed + provided by KNMI • wind vector + temperature, T derived from Mach number • every 4 sec • compared to AMDAR: • >10 x more data • no humidity, larger T error from: Lange and Janjic, MWR 2016
Task 2, extended use of observations: Mode-S aircraft • bug fixes in COSMO V5.04d • experiment 26 May – 10 June 2016 (‘E19’) • best results with thinning (40 % active) • Mode-S dominate above 800 hPa number of active obs • a-posteriori Desroziers statistics from DA experiment for estimation of obs errors: unexpected large Mode-S wind errors • data processing corrected by KNMI since 15 May 2017, re-processed historical data on request • new exp. ‘E22’ with re-processed data: Mode-S wind obs errors similar to AMDAR (but specified obs error variance still large)
Task 2, extended use of observations: Mode-S aircraft Mode-S aircraft : forecast verification (26 May – 10 June 2016) wind dir. RH wind dir. wind speed ps RH2M wind speed T T2M TD2M change in RMSE [%] • positive impact from Mode-S throughout
Task 2, extended use of observations: Mode-S aircraft 0-UTC runs 26 May – 10 June 2016 12-UTC runs Ref Mode-S (E19) Mode-S (E22) 0.1 mm/h 1-hrly precip FSS ( 30 km) 1 mm/h • Mode-S: clear long-lasting positive impact
Task 2, extended use of observations: Mode-S aircraft trial in parallel suite 1 – 28 Aug. 2017 1 – 20 Aug. 2017 , 0-UTC runs 0.1 mm/h RH ps RH2M T 1 mm/h T2M wind speed change in RMSE [%] • Aug. 2017: much smaller positive impact than in 2016 convective period ! Why? • weather? data quality, data cut-off time ? (the last 15 min of Mode-S obs not available in time)
Task 3: soil moisture analysis using satellite soil moisture (COMET) Task 3: Soil moisture analysis using satellite soil moisture • use of soil moisture products from HSAF based on ASCAT (+ SMOS, SMAP) • soil moisture DA (incl. QC, innovation statistics, bias correction) implemented in KENDA (to be done: different grid for computing weight matrices in soil) • running soil moisture DA in a parallel suite for longer period • work ceased for 7 months (EumetsatFellow Valerio Cardinalireplaced by Paride Ferrante)
Task 3, soil moisture analysis using satellite soil moisture (COMET) : Test 1: soil moisture obs influence ONLY low-level atmospheric variables KENDA (6h cycle) – 10 km, COSMO-ME domain LETKF settings: l_soil_ana = false; lh_wso = 25.0 (100 km) ; lv_wso = 0.3 verification: relative difference (%) in RMSE, computed against IFS analysis, with respect to reference run (NO soil moisture observations) for 00 UTC COSMO forecasts from 22 June – 23 July 2016 negative value = positive impact small positive impact on whole column for all variables / all lead times
Task 3, soil moisture analysis using satellite soil moisture (COMET) : Test 1: soil moisture obs influence ONLY low-level atmospheric variables Verification against SYNOP /TEMP observations 22 June – 23 July 2016 • Synopverif.: 2-m dewpoint temperature: rmse slightly improved, but bias increased • other variables: no impact TEMP verif. (not shown): wind vector: very little improvement of rmse temperature: no impact
New tests: soil moisture + T2M + RH2M obs influence low-level atmosphere + soil moisture LETKF settings (6-hr cycle, 10-km resolution on COSMO-ME domain) : wsolowatm : l_soil_ana = false; lh_wso = 25.0 (100 km) ; lv_wso = 0.3 wsofull25 : l_soil_ana = true ; lh_wso = 25.0 (100 km) ; lv_wso = 0.3, lh_soil = 25.0 (100 km) ; lv_soil = 0.3 wsofull12 : l_soil_ana = true ; lh_wso = 25.0 (100 km) ; lv_wso = 0.3, lh_soil = 12.0 ( 50 km) ; lv_soil = 0.3 “Full” assimilation of soil moisture (low atmosphere + soil) compared to first test (influence only low-level atmosphere) : Slight worsening of RMSE (Td, 10-m wind) and bias (Td)
Task 4.1: KENDA for ICON-LAM (incl. EnVar) Task 4.1: KENDA for ICON-LAM, incl. EnVar • MEC-based LETKF for ICON-LAM: ready to be tested (e.g. grid pt. assignment) (with COSMO obs operators)except for (hydrostatic) balancing step(s) & exclusion of obs near lateral BC • full 4-D LETKF for ICON-LAM: • implementing part of DACE code, incl. COSMO + global obs operators in ICON, first working version Nov. 2017 • thereafter: complement global obs operators by functionality of COSMO operators needed for EnVar(TL + adjoint of obs operators, incl. radar etc.) • first tests LETKF with ICON-LAM planned for spring 2018 (Hollborn)
Task 4.2: Particle Filter (PF) methods (to account for non-Gaussianity) • hybrid ETKPF (Sylvain Robert (ETH) et al., study finished): • 1-week DA with PF for conv. obs in COSMO: f.g. (+1h) slightly improved over LETKF • studying several algorithms for adaptive choice for weight of EnKF and PF in analysis (idea: use PF where useful, fall back on EnKF where Gaussian or PF does not work well) • QJRMS: “A local ensemble transform Kalman particle filter for convective scale DA” global TEMP verif, 2–24 May.2016 EnVar PF-Var • Local adaptive PF (Roland Potthast et al., ongoing): • work with global ICON (improved resampling to create new members) • PF runs stably in 1-month tests scores still about 20% worse than LETKF • hybrid PF-Var: using PF ensemble in EnVar for deterministic analysis: forecasts only slightly worse than operational EnVar with ensemble B from LETKF (promising!)
Progress in KENDA-O: Task 2: Extended use of observations 3-D radar radial velocity Vr • sensitivity tests (localisation; quality control, …) • convective 2-week exp.: - conv. + LHN + Vr-5min - conv. + LHN + Vr-1h : clearly better against radar Vr: positive up to +4h 15 days : 26 May – 10 June 2016 +1h +2h +3h +4h RMSE: Conv + LHN Conv + LHN + radar-Vr-1h
Task 2, extended use of observations: Radar radial velocity Vr 15 days : 26 May – 10 June 2016 radiosonde verification RH wind dir. Conv + LHN + 1h-radar-Vr vs. Conv + LHN wind speed T
Task 2, extended use of observations: Radar radial velocity Vr 1-h precip, FSS (30 km) 15 days : 25 May 12 UTC – 10 June 0 UTC, 2016 12-UTC runs 0-UTC runs Conv + LHN Conv + LHN + 1h-Vr Conv + LHN + 5min-Vr 0.1mm/h 0.1mm/h 1mm/h 1mm/h 5mm/h 5mm/h • positive impact for 0-UTC runs
Task 2, extended use of observations: Radar radial velocity Vr results of DA experiment: • temporal thinning of obs from 5 min to 1 hr very beneficial • impact (with 1-hrly obs) positive for precip up to ~ + 10 h , positive in verif. against radar radial winds up to + 4 h , slightly positive in radiosonde verif. (+ 12 h) , neutral in Synopverif. next: obs error, improved QC / data selection
Task 2, extended use of observations: Radar radial velocity Vr estimated Vr obs errors (std. dev., from Desroziers statistics, assimilating conv. + Vr (superobbing 10km) 15 days: 26 May – 10 June 2016) Elevations height [m] range [km] • obs errors highly dependent on elevation, height, range, and station • up to now, we use constant obs errors for KENDA exp.!
Task 2, extended use of observations: Radar radial velocity Vr 1-h precip, FSS (30 km) 15 days : 25 May 12 UTC – 10 June 0 UTC, 2016 12-UTC runs 12-UTC runs with additive inflation, COSMO V5.04d etc. Conv + LHN Conv + LHN + 1h-Vr Conv + LHN + 5min-Vr 0.1mm/h 0.1mm/h Conv + LHN Conv + LHN + 1h-Vr-el147 1mm/h 1mm/h 5mm/h 5mm/h • w/o using worst data: positive impact also for 12-UTC runs
DWD: pre-operational KENDA (setup) vs. operational nudging: winter test (22 Jan. – 24 Feb. 2016) , det. T2M deterministic forecasts: ~ neutral (precip, upper-air, surface verif.), except negative: 2-m temperature low stratus (cloud) (2 out of 3 cases) Nudging KENDA bias increased 2-m temperature bias: • due to underestimation of melting of soil ice in KENDA • due to insufficient Grib precision for soil temperature T_SO (!) when melting of soil ice, very small T_SO increase only T_SO : Grib accuracy too small same as in previous analysis soil ice: diag. from T_SO, W_SO same as in previous analysis melting of soil ice underestimated, more in 1-h cycling (KENDA) than in 3-h cycling (nudging) std.dev. rmse • Gribaccuracy for T_SO increased (COSMO V5.04c) operational since mid-Nov. 2016