Download
1 / 27
280 likes | 302 Views
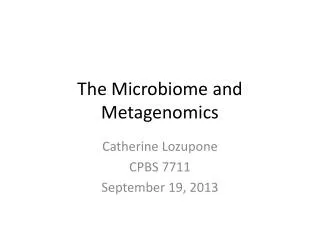
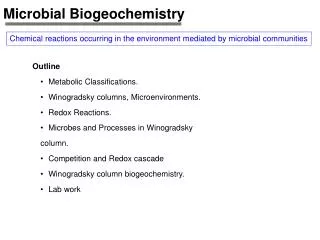
Metagenomics and biogeochemistry How do microorganism-driven geochemical cycles affect structure and function of ecosystems? How do we assess structure and function of ecosystems? How about starting by relating microbial assemblage composition to biogeochemical parameters and functions?

E N D
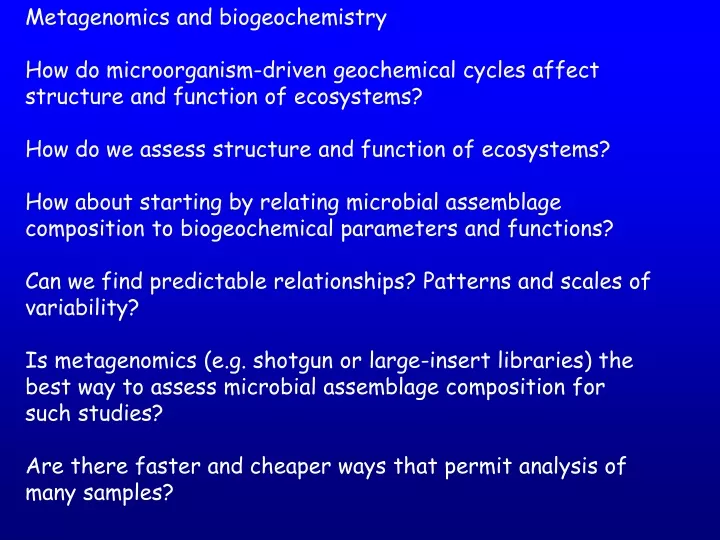
Metagenomics and biogeochemistry How do microorganism-driven geochemical cycles affect structure and function of ecosystems? How do we assess structure and function of ecosystems? How about starting by relating microbial assemblage composition to biogeochemical parameters and functions? Can we find predictable relationships? Patterns and scales of variability? Is metagenomics (e.g. shotgun or large-insert libraries) the best way to assess microbial assemblage composition for such studies? Are there faster and cheaper ways that permit analysis of many samples?
Amplified Ribosomal Intergenic Spacer Analysis (ARISA) PCR primers Fluorochrome 16S rRNA gene 23S rRNA gene Intergenic Spacer Variable Length For microbial community fingerprints with high phylogenetic resolution Start with DNA extracted from a mixed community. PCR spans rRNA operon, 16S to 23S genes. One tagged primer. PCR Fragment Size Fluorescence Fragment analysis. Smallest detectable peak ~0.1% of total Shows exact sizes. Each peak = “Operational Taxonomic Unit.” Data based, not gel-based. Ref: Fisher and Triplett 1999 16S-23S clone libraries to identify most peaks: Brown, Hewson, Schwalbach & Fuhrman, Envir. Microbiol 2005
16S-ITS Clone Library permits ID from ARISA. Example: USC Microbial Observatory 512 clones cover 94% of ARISA peaks Brown et al. 2005, Envir Microbiol.
Quantitation from PCR-based Fingerprinting? Real comparison: Prochlorococcus, ARISA vs flow cytometry counts San Pedro Ocean Time Series 4 year dataset Note: we use a highly standardized assay, with eukaryotes removed, and measured amounts of DNA R2=0.86 Flow cytometric counts % area from ARISA Fingerprint % area is remarkably proportional to counts. Also, SAR11 % clones are close to % cells. Brown, Hewson, Schwalbach & Fuhrman, Envir. Microbiol 2005
Replicate 20L samples have very similar ARISA fingerprints 7 samples from each of 2 North Pacific Gyre Stations Compares OTU proportions OTU Presence/absence only Hewson et al. Aquat Microb Ecol 2006
What is an ARISA OTU? Phylogenetic resolution is about 98% 16S rRNA similarity - comparable to “species” level Easily determined difference Brown et al, Env Microbiol 2005
Near-surface SAR11 subclades as determined by ITS sequences and lengths
45 km Temporal Variability in Bacterioplankton Communities How fast do communities change? San Pedro Ocean Time Series USC Microbial Observatory Measured Microbial and Oceanographic properties monthly since 2000, at depths to 880 m Also, daily measurements near USC Wrigley Marine Science Center on Catalina - open water accessible daily by small boat Follow taxa by ARISA to look for temporal diversity patterns
Relative stability over days at one location (open water, Catalina) Abundant taxa vary little Graphs: all OTU over 6 days g SAR 11 Actinobact date Rarer taxa can vary more Not just “noise” in measurement a g Prochlorococcus . Rarest detectable taxa CFB g SAR 11
Monthly observations at SPOTS over 4 years showed some taxa clearly had repeatable seasonal patterns. How about the bacterial community in general? Brown et al. 2005
Predictable Annual Bacterial Community Reassembly Fuhrman et al., PNAS 2006 with Shahid Naeem 171 taxa followed by ARISA over 4.5 years DFA scores reflect quantitative distribution of taxa via ARISA
DFA showed some subsets of bacterial taxa could predict the month of sampling with 100% accuracy. Multiple Regression with environmental parameters was highly significant (r2 ~0.7)– implies predictability of bacterial communities – even in an open marine system. Different subsets of taxa were predictable from different parameters – implies niches. Highly repeatable and predictable patterns imply little functional redundancy, contrary to common expectation for bacteria. This refers to combinations of functions in a particular taxon. Note- Not all taxa were included in the predictable subsets, but most were. Significant Parameters in MRA temperature, salinity, nitrite, nitrate, silicate, oxygen, bacterial and viral abundances, bacterial production via leucine and thymidine incorporation, chlorophyll, phaeopigments ARISA richness
The taxa that had significant multiple regression coefficients were affected by different parameters – many controlling factors, and different taxa controlled differently (niches).
Biogeography on a Global Scale SeaWiFS • Global survey of bacterioplankton at numerous sites in 3 ocean basins, under Arctic ice cap, and near Antarctica
Global Diversity Measurements via ARISA Assemblages clearly vary Coral Sea Arctic Ocean New Caledonia Philippines Deception Is, Antarctica Suva Harbor, Fiji Gerlache Strait, Antarctica Great Barrier Reef Villefranche (Med) Barbados Singapore Weddell Sea Long Island NY Norwegian Sea Catalina Island “Things change”
Bacterioplankton Biogeography • LATITUDINAL GRADIENT OF RICHNESS • ARISA measured the same way from 78 samples collected in all seasons and both hemispheres over 10 years (opportunistic sampling) • Diversity generally highest at low latitudes, lowest in polar environments – like animals and plants (in every general biology textbook) • Contrasts sharply with results reported for protists p<0.005 Highly significant (p<0.005) as linear regression, rank correlation, or with potential outliers removed
Regional Diversity Patterns Bacterial Community Similarity (via ARISA) vs Distance NEAR-SURFACE samples “Mixing” curve between Pacific and Indian Basins? Hewson et al 2006 Mar. Ecol. Prog. Ser.
Deep-Sea (500-3000 m depth) patterns differ with locations and depth. Cause(s) unknown North Atlantic 1000m depth samples were in vicinity of Amazon Plume Pacific * Pacific * Hewson et al. 2006 Limnol. Oceanogr.
Go beyond just observing nature - EXPERIMENTATION Example - What does proteorhodopsin do? Does it provide much energy, and help microbial growth, as many assume? Genomics alone can’t answer. Schwalbach et al. (2005 Aquat. Microb. Ecol. 39: 235) did light/dark experiments with oceanic plankton. Water collected from oligotrophic and mesotrophic Pacific Ocean locations, collected and stored in natural light or total darkness for 5-10 days. Bacterial assemblages monitored by the ARISA whole-community fingerprinting approach
EXPERIMENTAL TEST of Significance of Phototrophy. Light Removal Experiments – focus on Bacterial Groups that are supposed to have Proteorhodopsin P1 P2 Light 14:10hr cycle 110km rDNA 16s ITS 23s ABI 377XL Incubate bacteria in Light or Dark for 5-10 days Dark 24hr DAPI Cell Abundances Monitored over time Mesocosms (2x20L) Collect Cells After 5-10 days P3 DNA Extraction Bacterial Community Composition ITS Clone Library Construction rDNA PCR PCR Clone & Sequence 16s ITS 23s DNA 16S-ITS-23S ARISA Delineate 98% 16s rDNA ABI 377XL Database of ARISA OTU Identities Automated Ribosomal Intergenic Spacer Analysis
Schwalbach et al Aquat Microb Ecol 2005 Magnitude of change (n-fold difference) Cyano/Plastids Sar11 Sar86 CFB Roseobacter Sar116 Sar406 Actinobacter Fibrobacter Marinobacter Verrucomicrobia Light Removal Experiments, 5-10 days darkness Histogram summarizing magnitude of change in individual taxa, light vs dark treatments Most taxa were NOT affected by light removal # of OTU Dark preference Light preference Cyanobacteria & Phytoplankton exhibited consistent preference for light treatments Mixed Responses, mostly dark preference,in ALL OTHER “phototrophic” groups (e.g. SAR11, SAR86, CFB, Roseobacter) Number of taxa displaying response, ALL experiments
Conclusions of Schwalbach et al (2005) : Most taxa (including presumed PR-containing and bacteriochlorophyll a – containing groups) do not decline significantly in extended darkness, unlike cyanobacteria. In fact, most bacterial groups did no differently or much better in extended darkness than in normal light. Suggests no clear direct benefit from light for most organisms. But some organisms do benefit.
Even the one pure culture that contains proteorhodopsin grows no better in the light than in the dark Pelagibacter, in SAR11 cluster “The Pelagibacter proteorhodopsin functions as a light-dependent proton pump. The gene is expressed by cells grown in either diurnal light or in darkness, and there is no difference between the growth rates or cell yields of cultures grown in light or darkness.” Giovannoni et al. Nature 2005
Acknowledgements NSF, esp. Microbial Observatories Program USC Wrigley Institute Dave Caron Mark Brown Ian Hewson Mike Schwalbach Josh Steele Anand Patel Shahid Naeem Tony Michaels Doug Capone Ximena Hernandez R/V Kilo Moana R/V Seawatch Ajit Subramaniam Burt Jones
Other Issues Quantitation from Environmental Genomic Data Accurate prediction of biogeochemical (or any other) function from genes. “Genome Rot,” Multifunctional genes, e.g. generic reductases. More important with slow-growing organisms and “streamlined” genomes?
Quantitation Issues/Problems PCR Clone Libraries – Copy number bias mentioned yesterday. Primer Choice/Bias, Extension Bias? Yes, but how bad? Example – Marine Archaea compared to Bacteria. DISTANT Fuhrman et al. (1992) used universal primers, found 5 of 7 clones from 500 m were Crenarchaeota. DeLong (1992) used archaeal primers with surface waters only, and RNA hybridization to compare to Bacteria. Archaea <2%. Fuhrman and Davis (1997, univ. primers) Archaea were 1/3 of clones from 500 m – 3000 m, Atlantic and Pacific FISH results – Fuhrman and Ouverney 1998, Archaea to 40% at 600 m in Pacific, 60% at 200 m in Mediterranean. Karner et al. (2001) – Archaea ~30% below ~ 200m at HOT over > 1 year. Note – If QPCR shows doubling each cycle and if not at the saturation point, anything primed OK should quantify OK
Metagenomics BIAS? Missing rRNA genes from large-insert library All BLAST hits- % SSUrRNA Genes- Presence/absence DeLong et al. Science, 2006 SAR11