Download
1 / 32
320 likes | 322 Views
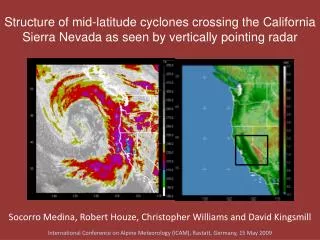
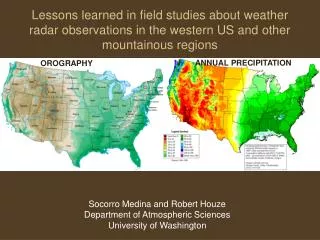
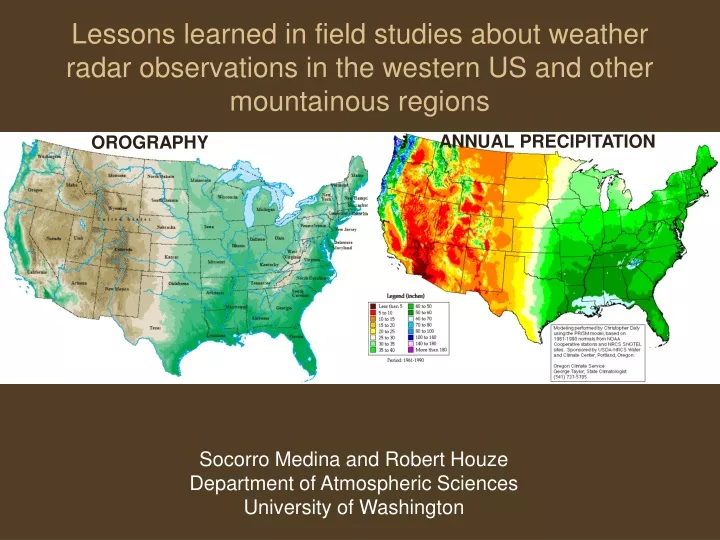
Lessons learned in field studies about weather radar observations in the western US and other mountainous regions. ANNUAL PRECIPITATION. OROGRAPHY. Socorro Medina and Robert Houze Department of Atmospheric Sciences University of Washington. Sponsored in part by: NSF Award# ATM-0505739

E N D
Lessons learned in field studies about weather radar observations in the western US and other mountainous regions ANNUAL PRECIPITATION OROGRAPHY Socorro Medina and Robert Houze Department of Atmospheric Sciences University of Washington
Sponsored in part by: NSF Award# ATM-0505739 NSF Award# ATM-0820586 NASA Award# NNX07AD59G
Relevant characteristics for radar purposes: • Complex terrain • High annual precipitation accumulation
The MM5 climatology was successfully validated over the Olympic Peninsula maxima (Minder et al. 2008) Orography (km) and 5-yr MM5 Nov-Jan precipitation climatology (mm) Minder et al. 2008
In addition, the western WA region is characterized by a low 0ºC level low bright band (BB) Nov-Jan 0ºC climatology for low-level moist onshore flow (Quillayute) Occurrence Height (km) Plots by Justin Minder
Field experiments in the region CYCLES IMPROVE-1 CASCADE Lessons learned from these past experiments IMPROVE-2 SCPP (Sierra) NOAA Hydro- Meteorological Testbed (HMT)
IMPROVE-1 domain (Jan – Feb 2001) NCAR S-band dual polarimetric radar (S-Pol) at the coast Picture credit: Peggy Taylor
Lesson 1: Low level PPIs (0.0 & 0.5º) observed the leading edge of storms several hours before they reached the coast Initial time: 2103 UTC 1 Feb Final time: 0206 UTC 2 Feb 5 hours lead time for this case Radar beam at ~ 4.5 km MSL
Lesson 2: Sea clutter was only a problem within the first ~20 km from the radar
Lesson 3: Ground clutter was a big problem, especially over the Olympic Mountains However this study was focused on the systems offshore, so it was not an issue for their purposes
IMPROVE-2 domain (Nov – Dec 2001) S-Pol looking directly at the Cascades Ground clutter was a big issue
Use of polarimetric variables for ground clutter elimination (87º RHI) RAW REFLECTIVITY Height Ground clutter Range dBZ PARTICLE IDENTIFICATION ALGORITHM BASED ON POLARIMETRIC VARS CLEAR AIR REFLECTIVITY (CLUTTER MAP) Ground clutter CORRECTED REFLECTIVITY
Lesson 4: Polarimetric variables were critical in dealing with severe ground clutter issues in mountainous regions RAW REFLECTIVITY CORRECTED REFLECTIVITY
Lesson 5: High resolution information on vertical structure of the reflectivity helpful in estimating rain-snow line • Rain-snow line: Altitude on the surface where snow changes to rain • Critical for hydrological purposes and flooding forecasting • Lundquist et al. (2008) found that using bight band heights measured by vertically pointing S-band radars improved the estimates of rain-snow line NOAA Hydro- Meteorological Testbed (HMT) Time (4 Jan 2008)
Lesson 6: RHIs provide high resolution information on the vertical profile of reflectivity (IMPROVE-1 example) Zooming in over the rectangle, it can be shown that the vertical resolution at close ranges from the radar ~ 0.03 km (similar to vertically pointing radar) Detailed information on vertical structure, including bright band height
Lesson 7: RHIs are also useful in providing the vertical structure of the cross-barrier wind (RHI at 90º across the OR Cascades, IMPROVE-2)
Besides ground clutter contamination, an additional concern when deploying a radar in mountainous terrain is beam blockage, which reduces visibility • Pink shading indicates radar coverage at 3 km MSL • Hatching indicates substantial blockage
Area of interest and possible locations 100 km range rings from Camano and Portland radars
Beam blockage for a radar at Westport (PRO: good visibility over full domain at 1º)(CON: A bit far from precipitation maxima in SW Olympics) PPI = 0.0º PPI = 0.5º PPI = 1.0º Blockage simulator of Lang et al. (2009)
Beam blockage for a radar at Pacific Beach(PRO: excellent visibility over ocean, close to precip max)(CON: blockage over S. Puget Sound) PPI = 0.0º PPI = 0.5º PPI = 1.0º Blockage simulator of Lang et al. (2009)
Beam blockage for a radar at Ocean City(PROs: Near precipitation maximum in SW Olympics, good coverage) (Area of blockage in NW Olympics due to closeness needed to map the SW Olympics well) PPI = 0.0º PPI = 0.5º PPI = 1.0º Blockage simulator of Lang et al. (2009)
To obtain unbiased reflectivity and high quality precipitation estimates, it is necessary to correct for beam blockage • Techniques used: • Use a digital elevation model to identify blocked rays and add a reflectivity correction based on the vertical profiles of the reflectivity at unblocked azimuths or obtained from climatology (e.g., Germann et al. 2006) • Use polarimetric data to correct the reflectivity (e.g, Gfiangrande and Ryzhkov 2005, Lang et al. 2009)
CONCLUSIONS • Low-level (0 and 0.5º) PPI scans provide information far upstream, over the ocean • Dual polarimetric variables are important since they: • Help quality control the data, in particular eliminate ground clutter contamination from mountains • Aid in producing high quality QPE • Can potentially be used to compensate for lost of radar energy due to beam blockage by the terrain • RHI scans provide vertical profiles of reflectivity and radial velocity, which are useful in: • Estimating rain-snow line • Compensating the reflectivity at blocked azimuths • Characterizing the low level flow with high vertical resolution