Download
1 / 15
150 likes | 158 Views
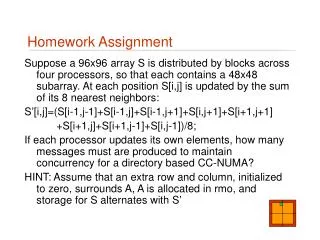
First Homework Assignment. Manipulating lots of data. Basline Subtracted Data. Moving Average Waveforms. Subtracting Baselines. Temperature anomaly for a year is simply that year’s temperature minus some constant that was obtained from your baseline averaging.

E N D
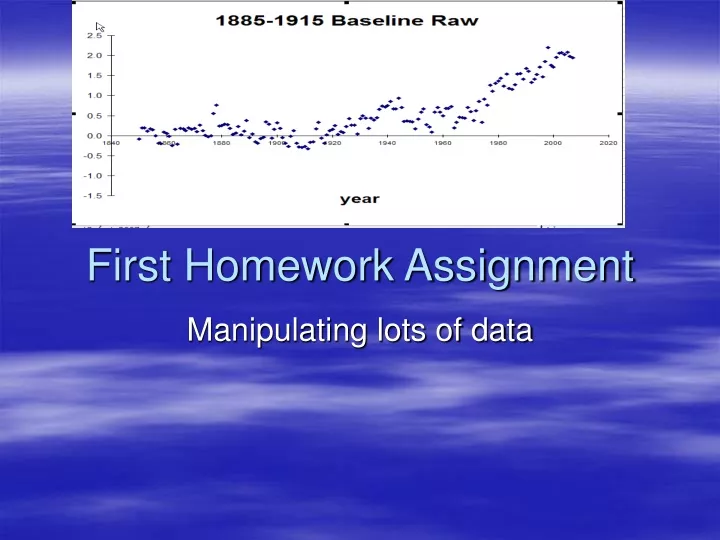
First Homework Assignment Manipulating lots of data
Subtracting Baselines • Temperature anomaly for a year is simply that year’s temperature minus some constant that was obtained from your baseline averaging. • The waveform is unaltered, only the zero level (or intercept) is changed • 1900 baseline average temperature is 0.9 C lower than 1961-1990
Slopes and Scatter • Slopes are in degrees C per decade • 1970: 0.22 +/-0.016 +/- 0.11 • 1915: 0.11 +/-0.005 +/- 0.16 • All: 0.06 +/-0.003 +/- 0.21 • 100: 0.10 +/-0.005 +/- 0.16 • 50: 0.18 +/-0.001 +/- 0.12 • 25: 0.20 +/-0.005 +/- 0.11
95% Confidence Temps in 2050 • All: 0.26 +/- 0.46 (relative to 2007) • 100: 0.46 +/- 0.37 • 50: 0.79 +/- 0.34 • 25: 0.86 +/- 0.24 • 1970 0.95 +/- 0.37 • 1915: 0.45 +/- 0.36 • Data is consistent with claim that 2050 temp will be 1-1.2 C (1.8-2 F) higher than now !
Global mean temperature (our values are slightly higher due too urbanization correction in the data) • Contamination and data reliability/correction problems render this approach the least convincing • This is reflected in the relatively large error bars on overall amplitude of warming
Consensus in Data Sets • But different analyses use different sets of thermometers and different selection criteria • Statistical agreement is good
Chi^2 • This was tricky and confusing • You need to compare data on a year by year basis • Pay attention to what happens on the whiteboard now • Chi^2 per degree of freedom for 1970 =1.53 • Chi^2 per degree of freedom for 1915 = 2.40
Central Europe Summer Signal • Huge statistical signal via baseline/area test
Baseline Variations • 1700-1750 15.94 4.41 • 1725-1775 15.91 4.21 • 1750-1800 15.93 3.92 • 1775-1825 15.82 3.98 • 1800-1850 15.57 4.15 • 1825-1875 15.67 4.32 • 1850-1900 15.67 4.39 • 1875-1925 15.44 4.56