Download
1 / 11
110 likes | 115 Views
Comparing International Assessments to NAEP. May 30, 2008 Eugene Owen Senior Advisor, NCES International Activities Program.

E N D
Comparing International Assessments to NAEP May 30, 2008 Eugene Owen Senior Advisor, NCES International Activities Program This paper is intended to promote the exchange of ideas among researchers and policy makers. The views expressed in it are part of ongoing research and analysis and do not necessarily reflect the position of the National Center for Education Statistics, the Institute of Education Sciences, or the U.S. Department of Education.
Goal of this Presentation • Present results from comparison studies to elaborate on international assessments: • How each is related to NAEP and • What each can contribute to the knowledge base on student performance
Recent Int’l and Nat’l Assessments 15 year olds PISA 2006* PISA 2006 PISA 2006
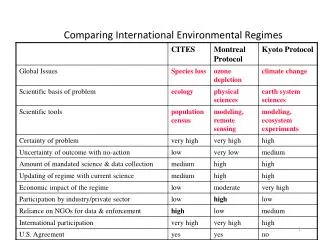
Overall Differences • Assessments have subtle but important distinctions with regard to U.S. curricula • International assessments provide benchmarks with different groups of countries • The students being studied may represent different groups of students • Different assessments are designed to measure at different levels of precision and disaggregation
Content Differences: General • Sources of difference • Framework Organization • Distribution of items across content areas and topics • Distribution of items across cognitive skills/ processes • General consistency with grade-specific content/topics in NAEP framework • Likelihood of being in U.S. curricula or on NAEP
Notes and comments on TIMSS-NAEP 2007 math comparisons • Some differences in distribution across cognitive domains (smaller between NAEP and TIMSS than PISA) • PISA most consistent with 8th grade topics in NAEP • Vast majority of TIMSS items are “likely” in U.S. curricula • Difficulty in placing some TIMSS items on NAEP framework reflects “holes” in NAEP framework • TIMSS has notable number of pattern problems, and problems requiring drawing symmetrical figures
Notes and comments on NAEP-TIMSS science comparisons • Vast majority of TIMSS items “likely in U.S. curricula” • Difficulty in placing some TIMSS items on NAEP framework reflects “holes” in NAEP framework • TIMSS has notable number of “science as context” items
Notes and comments on PISA-NAEP science comparisons • PISA items are equally consistent with the 8th and 12th grade NAEP frameworks (about 40% each) • “Rate” as a concept does not appear in the NAEP framework, whereas it is in numerous PISA items • The closer PISA comes to its objective of assessing scientific literacy, the harder it is to map items to NAEP • Over half rated as “not likely to be a NAEP item”