Download
1 / 29
290 likes | 297 Views
ChEMBL – Large-Scale Open Access Data for Drug Discovery John Overington EMBL-EBI jpo@ebi.ac.uk. Private to Public Domain Transfer. Five year strategic award from Wellcome Trust Large-scale Drug Discovery Structure Activity Relationship (SAR) data

E N D
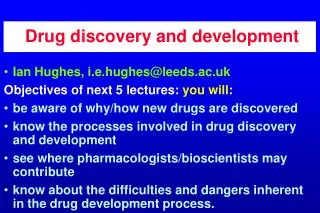
ChEMBL –Large-Scale Open Access Data for Drug DiscoveryJohn OveringtonEMBL-EBIjpo@ebi.ac.uk
Private to Public Domain Transfer • Five year strategic award from Wellcome Trust • Large-scale Drug Discovery Structure Activity Relationship (SAR) data • Linking small molecule structures to ‘targets’ and pharmacological activities – Chemogenomics/Chemical Biology • ‘Open Access’, ‘User Friendly’, ‘Translational’, ‘Free’ • Multiple access mechanisms • Full database download, web front-ends, web services • Actively support ad hoc sabbaticals (academic and commercial) at EMBL-EBI
ChEMBL Research Strategy • Comprehensively catalogue historical drug discovery • Include successes and failures • Drugs can be small molecules, recombinant proteins, siRNA, etc. • Derive rules for drug discovery ‘success’ from these data • Target selection and prioritisation • Lead discovery, optimisation, candidate selection
Drug Discovery Process (simplified) Clinical Trials Target Discovery Lead Discovery Lead Optimisation Preclinical Development Phase 1 Phase 2 Phase 3 Launch • Target identification • Microarray profiling • Target validation • Assay development • Biochemistry • Clinical/Animaldisease models • Medicinal Chemistry • Structure-baseddrug design • Selectivity screens • ADMET screens • Cellular/Animaldisease models • Pharmacokinetics • High-throughputScreening (HTS) • Fragment-basedscreening • Focused libraries • Screening collection • Toxicology • In vivo safety pharmacology • Formulation • Dose prediction Safety & Efficacy Indication Discovery & expansion PK tolerability Efficacy Discovery Development Use Med. Chem. SAR ClinicalCandidates Drugs >450,000 distinct compounds ~25,000 distinct lead series ~1,300 drugs ~12,000 candidates
ChEMBL: Launched Drugs • Database of all approved drugs • Chemistry and sequence ‘aware’ • Contents • Small molecules and biological therapeutics • USANs, INNs, research codes, other synonyms • Pharmaceutical properties, prodrugs, dosage, form, etc • PK data and metabolites, black box warnings, etc. • 1,378 chemically distinct ‘drugs’, 324 distinct molecular targets • Controlled vocabulary indications dictionary and hierarchy
New Drugs 2006-2009 Enzyme mAb Peptide Other Protein Synthetic small molecule Natural Product
ChEMBL: Launched Drugs Nat. Rev. Drug Disc., 5, pp. 993-996 (2006)
ChEMBL: Drug Dosage ~150-200mmol 80 mmol mmol nmol 70 60 50 40 30 Metformin, Hydroxyurea 20 Steroids, thyroids 10 0 -8.4 -8.08 -7.76 -7.44 -7.12 -6.8 -6.48 -6.16 -5.84 -5.52 -5.2 -4.88 -4.56 -4.24 -3.92 -3.6 -3.28 -2.96 -2.64 -2.32 Binned log10 mole dose
Affinity Of Drugs For Their Targets • Retrieved Ki, Kd, IC50, EC50, pA2, … endpoints for drugs against their ‘efficacy targets’ 400 350 300 250 Frequency 200 150 100 50 0 2 3 4 5 6 7 8 9 10 11 12 -log10 affinity 10mM 1mM 100mM 10mM 1mM 100nM 10nM 1nM 100pM 10pM 1pM
Function for Drug Efficacy/Affinity • Empirical function that estimates the probability of in vivo activity for a compound with acceptable PK characteristics as a function of target affinity 1.0 0.8 mM mM nM pM 0.6 P(efficacy) 0.4 0.2 0.0 0 2 4 6 8 10 12 -log10 Affinity
ChEMBL: Clinical Candidates • Database of clinical development candidates • Contains ~10,000 2-D structures • Estimated size ~35-45,000 compounds • Work in progress • Deeper coverage of key gene families • e.g. Protein kinases, 184 distinct clinical candidates VEGFR 90 80 70 PDGFR 60 50 40 p38a 30 20 C-Kit 10 Aurora CDK 0 Launched III II I ErbB Kinase clinical candidates by highest phase Clinical candidates by target
Industry Productivity File Registration number vs USAN date 800000 700000 600000 500000 400000 300000 200000 100000 0 1960 1965 1970 1975 1980 1985 1990 1995 2000 2005 2010
Industry Productivity 70 64 USANs/100,000 compounds 60 16 Drugs/100,000 compounds 50 40 30 1.9 USANs/100,000 compounds 20 0.4 Drugs/100,000 compounds 10 0 1- 100,000 100,001- 200,000 200,001- 300,000 300,001- 400,000 400,001- 500,000 500,001- 600,000 600,001- 700,000 700,001, 800,000 File registration number range USAN assignment typically at entry to phase 3
ChEMBL: SAR data Compound Target StARLITe Bioactivity >Thrombin (Homo sapiens) MAHVRGLQLPGCLALAALCSLVHSQHVFLAPQQARSLLQRVRRANTFLEEVRKGNLERECVEETCSYEEAFEALESSTATDVFWAKYTACETARTPRDKLAACLEGNCAEGLGTNYRGHVNITRSGIECQLWRSRYPHKPEINSTTHPGADLQENFCRNPDSSTTGPWCYTTDPTVRRQECSIPVCGQDQVTVAMTPRSEGSSVNLSPPLEQCVPDRGQQYQGRLAVTTHGLPCLAWASAQAKALSKHQDFNSAVQLVENFCRNPDGDEEGVWCYVAGKPGDFGYCDLNYCEEAVEEETGDGLDEDSDRAIEGRTATSEYQTFFNPRTFGSGEADCGLRPLFEKKSLEDKTERELLESYIDGRIVEGSDAEIGMSPWQVMLFRKSPQELLCGASLISDRWVLTAAHCLLYPPWDKNFTENDLLVRIGKHSRTRYERNIEKISMLEKIYIHPRYNWRENLDRDIALMKLKKPVAFSDYIHPVCLPDRETAASLLQAGYKGRVTGWGNLKETWTANVGKGQPSVLQVVNLPIVERPVCKDSTRIRITDNMFCAGYKPDEGKRGDACEGDSGGPFVMKSPFNNRWYQMGIVSWGEGCDRDGKYGFYTHVFRLKKWIQKVIDQFGE Ki=4.5 nM • Bioactive compounds • Link through to validated synthetic routes and assay protocols • Bidirectionally linking compounds to/from targets • Built from 12 primary journals • J.Med.Chem. Biorg.Med.Chem., PNAS, JBC, Bioorg.Med.Chem.Letts., Eur.J.Med.Chem., DMD, Xenobioitica, Nature, Science, AACR, J.Nat.Prod. • StARlite 1 – June 2001 • StARlite 31 – August 2008
Drug Optimisation Imidazole triazole Prototype 1st generation 2nd generation 3rdgeneration 4thgeneration Tinidazole 1970 Metronidazole 1962 Terconazole 1980 Posaconazole 2005 Itraconazole 1984 Ketoconazole 1978 Clotrimazole 1970 Azomycin (1956) Streptomyces natural product trichomonacidal ‘toxic’ Sulconazole 1980 Miconazole 1970 Voriconazole 2002 Fluconazole 1988 Econazole 1972 Bifonazole 1981 Fosfluconazole 2004 After W. Sneader
ChEMBL SAR Contents • Abstracted from 26,299 papers from 12 journals • Monthly update cycle - optimised curation pipeline • Autocuration tools – clean up and index other large SAR datasets • Updates and ongoing curation process all data, not simply new article data • 521,237 compound records • 440,055 distinct compound structures • 5,439 targets • 3,512 protein molecular targets • ~2,200 orthologous targets (1,644 human) • 1,936,969 million experimental bioactivities Counts refer to StARlite release 31
Rule-based Optimisation – Bioisosteres Search StARLITe for functional group Search for all ‘contexts’ where acid has been replaced StARLITe Retrieve assay value • Identify data-driven ‘rational’ lead-optimisation strategies • Useful in automated design • e.g. Replacement of carboxylic acid • Reflect synthetic ease and expectation for functional effect DIC50 60 sulphonamide 50 40 tetrazole Frequency (%) 30 20 sulphonic acid 10 ester -6 -4 -2 0 2 4 6 Effect on affinity (-log10 IC50)
Typical Compound Collection - Novartis N N N N N N N S N N S N N N N O N N N N O N N N N O N N O O N O N N O N S N N N N N N N N N N N O N N benzene pyridine piperidine piperazine cyclohexane pyrimidine indole imidazole naphthalene morpholine thiophene pyrazole pyrrolidine thiazole furan cyclopropane benzimidazole pyrrole quinoline imidazoline cyclopentane pyran quinazoline benzthiazole benzodioxole isoxazole purine tetrahydrofuran triazole tetrahydroisoquinoline adamantane tetrazole triazine isoquinoline benzofuran Ertl, Koch and Roggo, Novartis
Screening File Comparison - Novartis Depleted fragments 35 tetrazole Enriched fragments 30 purine tetrahydrofuran 25 20 Novartis rank 15 pyrrolidine pyrazole 10 morpholine pyrimidine 5 piperidine benzene StARLITe rank pyridine 0 0 5 10 15 20 25 30 35
Genome-Scale Druggability Assessment Nat. Rev. Drug. Disc., 8, pp. 900-907 (2008) Nature 460, 352-358 (2009) • Now possible to rapidly map chemical intervention points onto genomic data • In ‘real time’ as gene model is developed • Develop therapeutic hypotheses for expert review/analysis/validation • Reuse existing drugs/clinical candidates in new contexts • Anticipate required optimisation (comparative modelling, etc)
Indication Discovery Marks et al., Lancet, 367, pp. 668-678 (2006) • Map chemical biology/pharmacology data onto microarray datasets • Rapid path to clinic and patient benefit • Develop therapeutic hypotheses for expert review/analysis/validation • Reuse existing drugs/clinical candidates in new contexts Marks et al., Lancet, 367, pp. 668-678 (2006)