Download
1 / 56
560 likes | 563 Views
Explore the economic and population trends, job growth, educational challenges, healthcare demands, logistics, construction, and real estate in the Inland Empire. Discover the potential impact of tariffs, recession predictions, and the growing marijuana industry. Uncover the housing market dynamics, tax revenues, and the future of key sectors like finance, real estate, and education.

E N D
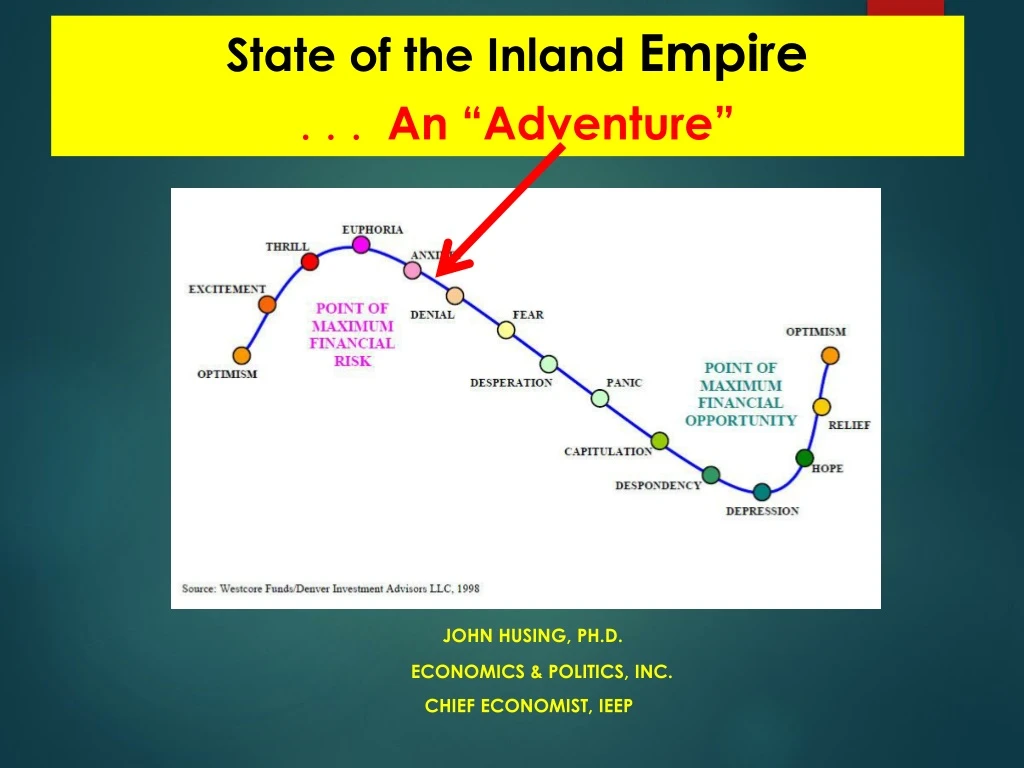
State of the Inland Empire . . . An “Adventure” John Husing, Ph.D. Economics & Politics, Inc. Chief Economist, IEEP
Inland Empire Population Chino 86,757 Chino Hills 83,159 Greater Than 25 of 50 States
Population Forecast, 2018-2045 2045: 6,119,497 1,111,783
Educational Challenge Chino 49.6% Chino Hills 24.3% Chino 26.7% Chino Hills 55.4%
Poverty Falling With Job Creation Chino 17.2% Chino Hills 7.5% Chino 13.6% Chino Hills 9.0% 23.5% 16.4%
17.9% Add Potential Workers: Given Up Or Part Time 10.1% 6.9% 3.6%
Inflation: NOT MUCH! 3.3% 2.0%
Interest Rates: A Short Term Rate Decrease? 4.12% 2.50%
Yield Curve: Potential Recession Predictor Recession: 2020 Likelihood An Issue 2 Year to 10 Year 0.22%
Gold Mine Theory Secondary Tier Primary Tier
Median Health Care Pay: 2018 $62,363
ACA & Health Care Demand Chino 6.9% Chino Hills 1.6% -60% Drop in Uninsured
2019 Forecast: 4,800 Rationale: Health Providers Paid 65% of Medicaid Costs Shortage of Trained Workers ACA Attacks
Median Logistics Pay: 2018 $47,946
E-Commerce 14.5%
2019 Forecast: 9,000 Rationale: Running Out of Land in the Valley Areas Tariffs Shortage of Trained Middle Managers U.S. Growth Slowdown
Disappearing Available Space For Facilities x 23,000,000 sf under construction Dec-2018
ONT Airport Cargo Another Record Volume 12.4% 0.9%
ONT Airport Passengers 12.4% 1989 Level 4.6% 1988-2018 Population: up 2.4 million or 108.2% to 4.6 million Job Level: up 864,502 or 133.5% to 1,512,194 Companies: up 75,133 or 187.3% to 75,133
2018 Median Manufacturing Pay $54,800
CA Electrical Cost +88.0% +127.8%
2019 Forecast: 1,000 Rationale: Regulation & CA Electrical Costs Tariffs Shortage of Replacement Skilled Workers U.S. Growth Slowdown
Median Construction Pay: 2018 $53,322
Home Prices Chino $541,000 Chino Hills $1,054,000 Chino $497,000 Chino Hills $632,000 +4.2% -9.4%
Price Competition Highest Price Gaps In History
2019 Forecast: 6,000 Rationale: Difficulty Permitting Lots CA Environmental Quality Act Very High Prices, Low Volume, Lack of Supply Shortage of Skilled Craft Workers
Median Government Pay: 2018 $63,499
Assessed Valuation Chino $13.4 billion; Up 9.7% Chino Hills $12.3 billion; Up 6.3% 2008 peak to 2018 AV in RivCo up 16.9% AV in SBCo up 21.9% Inflation Up 16.0%
Taxable Sales Chino $2.5 billion; 9.6% Chino Hills $0.7 billion: 10.4% 2006-2017 RivCo Up 21.2% SBCo Up 21.9% Inflation Up 21.7%
2019 Forecast: 3,500 Rationale: Education Gap To Coastal Counties Government Tax Revenue Difficulty (internet)
Median Moderate Paying & Real Estate, Finance, Education Jobs: 2018 $57,109
2019 Forecast: 3,900 Rationale: Banks Hiring Less Real Estate Sales Not Growing School Budget Growth May Slow
Population Serving Sectors E-commerce death High End Consumers Still Doing Well 3rd Strongest Inland Sector