Download
1 / 27
280 likes | 306 Views
The impact of observations in the latest ECMWF reanalysis system. András Horányi , Paul Berrisford, Gionata Biavati, Dick Dee, Hans Hersbach, Joaquin Munoz-Sabater, Iryna Rozum, Adrian Simmons, Cornel Soci and lot of collaborators

E N D
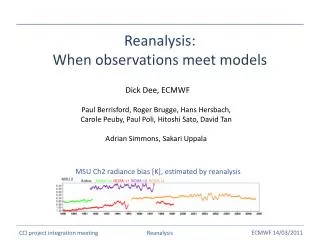
The impact of observations in the latest ECMWF reanalysis system András Horányi, Paul Berrisford, Gionata Biavati, Dick Dee, Hans Hersbach, Joaquin Munoz-Sabater, Iryna Rozum, Adrian Simmons, Cornel Soci and lot of collaborators special thanks to Carla Cardinali for the interpretation of the DFS results WMO workshop, Shanghai, 10-13 May, 2016
Initial remarks It is the first (and hopefully not the last) reanalysis talk in the history of the „WMO workshops on the impact of various observing systems on NWP”! BUT: might be interesting, since it provides information about the evolution of the observing system from the NWP perspective some of the results discussed earlier this week will be recalled/confirmed
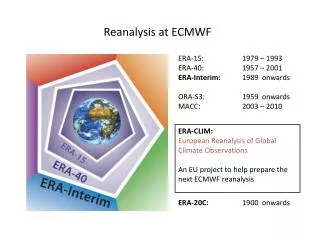
Table of content • Brief introduction to the ECMWF’sCopernicusERA5 reanalysis system (this is thenewgeneration ECMWF reanalysissystemsucceedingERA-Interim) • Impact of observations in the early ERA5 reanalysis suites
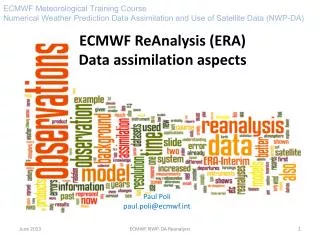
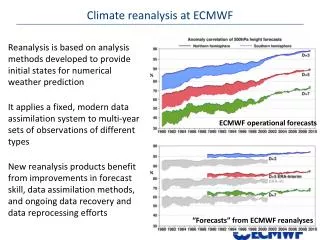
Reanalysis: consistency • Consistent reconstruction of the atmosphere, waves (and ocean): • merge observations into global fields, • using the laws of physics • and appropriate bias correction scheme • maintain the same up-to-date system • over the entire reanalysis period. • At lower resolution to keep affordable
Newly reprocessed data sets The evolving observing system Radiances: SSM/I brightness temp from CM-SAF METEOSAT from EUMETSAT Atmospheric motion vector winds: METEOSAT, GMS/GOES-9/MTSAT, GOES-8 to 15, AVHRR METOP and NOAA Scatterometers: ASCAT-A, ERS 1/2 soil moisture Radio Occultation: METOP GRAS, COSMIC, CHAMP, GRACE, SAC-C, TERRASAR-x Ozone: NIMBUS-7, EP TOMS, ERS-2 GOME, ENVISAT SCIAMACHY, Aura MLS, OMI Data not used by ERA-Interim (due to lack of infrastructure) Improved data usage IASI, ASCAT, ATMS, Cris, Himawari, FY-3 … all-sky vs clear-sky assimilation, latest radiative transfer function, … Typically the latest instruments: ERA5 is more future proof!
Some initial verification of the 2014-NRT stream ERA5: forecast skill ERA-I ERA5 OPER 500 hPa Geopotential, SHem 500 hPa Geopotential, Europe Scores not far from ECMWF operational, much better than for ERA-Interim Tropical cyclone “Halong”: evolution of the minimum pressure (much better than ERA-Interim, comparable to operations) OPER, ERA5, EDA, ERA-INTERIM Credits to Linus Magnusson
ERA5: preparations and streams • We have started the theearlysuitesof ERA5 (scan and checkthe observationsforthe 40 years, develop monitoring tools, archiving, post-processing etc.) • ERA5 to be completed until the end of 2017 (and continue the near real time production beyond) • ERA5 streams: 1979-1990, 1989-2000, 1999-2010, 2009-2017, 2014- (Near Real Time Production) • Note: thesesuitesarejuststarted…
How to quantify it? • OSE-type of assessment: very costly (thoughtherewill be someexperimentsfor GNSS-RO) • EDA: might be an option forinformationcontentstudiessinceEDA is used to compute background error covariances • Adjointobservationdiagnostics: • DFS (Degree of Freedom for Signal; analysisimpact): practically free of charge • FSOI (Forecast Sensitivity Observation Impact; forecastimpact): toocostly (butmight be consideredforshorterperiods) Impact of observations in reanalysis
Forecast/analysis sensitivity to observations Aim: quantify the impact of observations Je is a measure of the forecast error e.g in energy norm Cardinali et al, 2004; Lupu& Gauthier, 2010 Forecast error sensitivity to the analysis (Rabier et al, 1996) Forecast Sensitivity Observation Impact (FSOI) Degree of Freedom for Signal (DFS) and Observation Influence (OI; DFS per datum) Observation Influence is complementary to Background Influence (impact/weight of observations in the analysis)
These are VERY preliminary resultsbased on initial“scout reanalysis runs” (some suites areto be improved) • The results depend on the observing and model systems used (they are not absolute) • DFS (OI) providesinformationonlyabouttheinfluence of observationintotheanalysis, butdoesnottelliftheimpact is positiveornegative (though: DFS and FSOI fractionalimpactsaregenerallysimilar) • Errorbarsarenotshown, butonly „largescale” issueswill be discussed DFS and OI results: some remarks IN THE NEXT FIGURES FRACTIONAL OBSERVATION AMOUNTS/DFS, AND OI WILL BE SHOWN AND ALSO SOME OI CHARTS
1979 suite: DFS (%), OBS (%) and OI • Conventional vs. satellite observations: 35%-65% • Conventional vs. satellite DFS: 75%-25% • The conventional observations have an overwhelming impact! • The radiosondes are the most influential • The buoys have the largest impact per observation(as today), smallweight is giventothesatellitedata
Radiosonde winds for 0-400 hPa 1979 suite – Observation Influence:radiosondes vs. HIRS Uniformly large impact the overall impact is large TIROS-N HIRS channel 6 radiances Large impact at the polar regions (to be checked) the overall impact is smaller (but still more than 10%)
1989 suite: DFS (%), OBS (%) and OI • Conventional vs. satellite observations: 22%-78% • Conventional vs. satellite DFS: 40%-60% (satellites take over) • The satellite observations are getting larger overall impact • HIRS have the largest impact (closely followed by radiosondes) • The per observation impact of satellite data largely increased
NOAA-11 HIRS, channel 11 radiances 1989 suite –Observation Influence: HIRS vs. radiosondes Increased impact at the mid-latitudes the overall impact had been increased (more than 30% by now) Radiosonde winds for 0-400 hPa Similarly large impact than for the previous stream
1979 vs 1989 suite – Observation Influence:radiosondes vs. HIRS
1999 suite: DFS (%), OBS (%) and OI • Conventional vs. satellite observations: 15%-85% • Conventional vs. satellite DFS: 28%-72% • The satellite observations are dominating (quantity and impact) • AMSU-A, SSMI, HIRS and SATOB: the largest sat. contributors • Aircraft data are getting equally important than radiosondes
NOAA-15 AMSU-A, channel 8 radiances 1999 suite - Observation Influence: AMSU-A for two satellites Reasonably large per observation impact especially at mid-latitudes (overall 24%) NOAA-16 AMSU-A, channel 8 radiances
ACAR windspeed at 0-400 hPa 1999 suite – Observation Influence: ACAR vs. radiosondes Good ACAR coverage and impact particularly in areas with less radiosondes (Pacific) Radiosonde winds for 0-400 hPa
2009 suite: DFS (%), OBS (%) and OI • Conventional vs. satellite observations: 8%-92% • Conventional vs. satellite DFS: 18%-82% • AMSU-A, AIRS, IASI and GNSS-RO: largest satellite contributors • Large OI for allsky-TMI (MW humidity sounder), also GNSS-RO • Aircraft are the most influential conventional observation (due to its growing number)
AMDAR winds at 0-400 hPa 2009 suite – Observation Influence: AMDAR vs. all-sky radiances Uniformly large impact All-sky TRMM/TMI channel 6 radiances Strong tropical impact
2015 suite: DFS (%), OBS (%) and OI • Conventional vs. satellite observations: 10%-90% • Conventional vs. satellite DFS: 20%-80% • IASI, AMSU-A, AIRS and CRIS as largest satellitecontributors • Impact of SYNOPs is getting similarthan radiosondes (aircraftareclearlydominantamongtheconvntionalobservations)
METOP-A IASI channel 335 radiances 2015 suite –Observation Influence: IASI vs. SYNOP pressure Large impact at the tropical and polar regions SYNOP pressure Uniformly large impact
ERA5 reanalysiscoversthe „satelliteera”, i.e. thesatelliteobservationsarealwaysdominatinginobservationquantities(reaching 90% today) • The totalinfluence of conventionalobservationsarealways and stilllarge (now: doublethantheirobservationamountwouldsuggest) • The per observationimpact of conventionalobservationsarealwayslargerthanthatofthesatellites • The per observationimpact of satelliteobservations had beenincreased(especiallyfortheall-skyradiances, for GNSS-RO itwasalwayslarge) Summary, conclusions (1)
The influence of theaircraft and surfaceobservations had beenincreasedwithtime (withrespecttoradiosondes, whichwasdominantattheearlytimes). • History of satelliteobservationinfluences: HIRS (80s, 90s) AMSU-A (end of 90s) IASI (AIRS) Summary, conclusions (2)
ERA5 outlook • ERA5 availability: • End of 2016: 2010 to NRT available • 2-years from now: 1979-2009 • Afterwards: continuation in near real time Thankyou!