Download
1 / 35
360 likes | 553 Views
UW WORKERS COMPENSATION CLAIMS: FIVE YEAR CLAIM HISTORY 1/1/05 – 12/31/09. University of Washington Office of Risk Management Claims Services Program March 2010. Workers Comp Claim Rates by State. Nation-wide Occupational Injury/Disease Rates per 100 FTEs.

E N D
UW WORKERS COMPENSATION CLAIMS: FIVE YEAR CLAIM HISTORY1/1/05 – 12/31/09 University of Washington Office of Risk Management Claims Services Program March 2010
UW Claim Frequency (claims received in last 5 years, open and closed)
UW Claims Frequency by Division(claims received in last 5 years, open and closed)
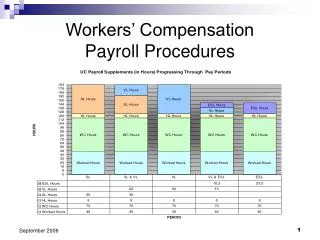
UW-Wide Time Loss Days (days out on open and closed claims each calendar year)
UW-Wide Time Loss Days by Division (closed claims 1/1/04 – 12/31/09) Average Time Loss Days
TL Days Five Year Trend for each Division(days out on open and closed claims each calendar year)
UW- Wide Time Loss Dollars Paid by Year(Time Loss paid on open and closed claims each calendar year)
Time Loss $ Paid by Division (closed claims 1-1-04 – 12-31-09) Average Time Loss $ Paid
Time Loss $ Trend for Top Divisions(Time Loss paid on open and closed claims each calendar year)
UW Claims by Injury Type ( closed claims 1/1/04 – 12/31/09, ranked by TL $ Paid)
Injury Types: Medical Centers UWMC HMC
Injury Types: Facilities and Student Life Facilities Student Life
Claims by Position (closed claims 1/1/04 – 12/31/09, ranked by TL $ Paid)
Claims By Position: Medical Centers UWMC HMC
Claims By Position: Facilities and Student Life Facilities Student Life
Claims by Diagnosis (closed claims 1/1/04 – 12/31/09, ranked by TL $ Paid)
Top Diagnoses: Medical Centers UWMC HMC
Top Diagnoses: Facilities and Student Life Facilities Student Life
Claims by Body Part • (closed claims 1/1/04 – 12/31/09, ranked by TL $ Paid)
Claims by Body Part: Medical Centers UWMC HMC
Claims by Body Part: Facilities and Student Life Facilities Student Life
Safety is Job #1! • Avoiding worker injuries protects our employees, reduces insurance costs, and increases UW productivity. • Partnership with EH&S on data and safety issues • Sharing of Workers Comp data real-time • To ensure incident reports are complete • To ensure OSHA reporting is accurate • To share trends on safety issues • Triage discussions on unusual or severe incidents so UW responds appropriately and as a team • Initiatives to address trends – i.e., ergonomics, lifting, etc
Key to Controlling Costs: Return-to-Work • Benefits to UW • Lower L&I premium • Allows retention of employee’s skill and experience • Keeps productivity loss to a minimum • Reduces costs of training new employee or temps • Creates opportunity to complete work usually left undone • May reduce risk of re-injury • Benefits to the Injured Worker: • Keeps the employee active and speeds medical recovery • Shifts focus from “dis-ability” to ability • May reduce the risk of re-injury • Provides a sense of job security • Allows employee to maintain contact with co-workers • Shows you value your employee and his/her contributions to UW Source: "Employer's Return-To-Work Guide", WA Department of Labor and Industries, Workers' Compensation Services
UW’s Return to Work Program • Risk Management serves as UW’s required return-to-work coordinators (RCW 41.06.490) • Requires strong teamwork with L&I, HR, Supervisor/Department, Physician • Focus is on early, supportive communication with injured worker on opportunities to stay at work within restrictions • Return to Work Options • Modify current work • Part time work • Alternative work (temporary) • Alternative work (permanent) • Light duty job descriptions should be developed and readily available for positions with claim frequency • “We don’t have light duty” is rarely acceptable
Contact Us • Shari Spung, Director, Claims Services Program (sspung@uw.edu, 206 616 3455) • Wendy Winslow-Nason, Sr. Claims Specialist (wendywn@uw.edu, 206 616 7510) • Elena Williams, Claims Specialist (elenaw2@uw.edu, 206 616 3329) • Linda Chihara, Program Coordinator (lchihara@uw.edu, 206 543 0183) • Felicia Carnes, Program Coordinator (fml@uw.edu, 206 543 3657)