Download
1 / 29
300 likes | 409 Views
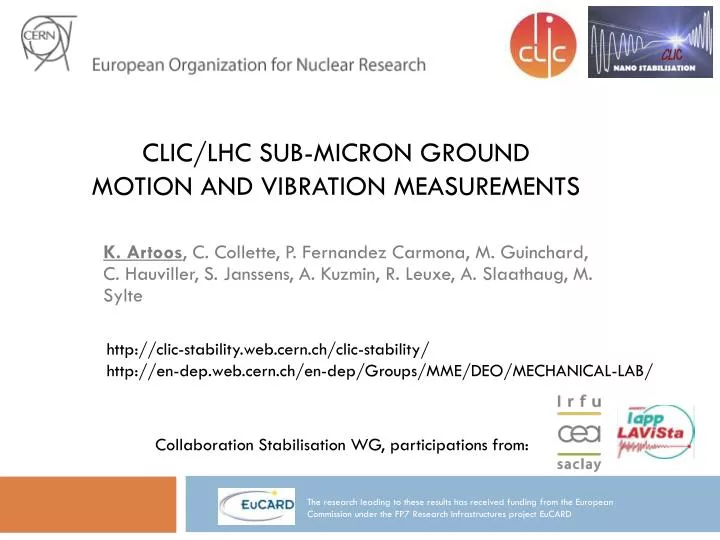
CLIC/LHC sub-micron ground motion and vibration measurements. http://clic-stability.web.cern.ch/clic-stability/ http://en-dep.web.cern.ch/en-dep/Groups/MME/DEO/MECHANICAL-LAB/. Collaboration Stabilisation WG, participations from:.

E N D
CLIC/LHC sub-micron ground motion and vibration measurements http://clic-stability.web.cern.ch/clic-stability/ http://en-dep.web.cern.ch/en-dep/Groups/MME/DEO/MECHANICAL-LAB/ Collaboration Stabilisation WG, participations from: K. Artoos, C. Collette, P. Fernandez Carmona, M. Guinchard, C. Hauviller, S. Janssens, A. Kuzmin, R. Leuxe, A. Slaathaug, M. Sylte The research leading to these results has received funding from the European Commission under the FP7 Research Infrastructures project EuCARD
Outline • Measurement devices • Measured quantities • Coherence and propagation local vibrations sources • Some measurements around CMS • Conclusions K.Artoos,CLIC CES WG, CERN, 16 February 2011
Streckeisen STS2 Guralp CMG 3T Guralp CMG 40T Guralp CMG 6T Eentec SP500 PCB 393B31 x,y,z x,y,z x,y,z z z x,y,z 2*1000Vs/m 30s-80Hz electrochemical 2*750Vs/m 2*750Vs/m 2*800Vs/m 2000Vs/m 1.02Vs2/m 120 s -50 Hz 360s -50 Hz 30 s -50 Hz 60 s -70 Hz 10 s -300 Hz 13 kg 13.5 kg 7.5 kg 0.750 kg 0.635 kg Measurement devices How to measure nanometers and picometers ? Catalogue products • Absolute velocity/acceleration measurements • Seismometers (geophones) • Accelerometers (seismic - piezo) K.Artoos,CLIC CES WG, CERN, 16 February 2011
Equipment and settings • Vibrations sensors • Data acquisition system • Spectrum analyser with 16 channels • 24 bits on 10mV for the lowest dynamic range • Sampling frequency up to 200kHz • Noise level DAC< 1 μV • Software for signal treatment (FFT, PSD, Filtering, etc…) Parameters: K.Artoos,CLIC CES WG, CERN, 16 February 2011 M. Guinchard, M. Sylte
PSD, RMS objectives K.Artoos,CLIC CES WG, CERN, 16 February 2011
Characterisation vibration sources Measurements LAPP, DESY, SLAC, ... Broadband seismometers characterisation > 50 references on http://clic-stability.web.cern.ch/clic-stability/ More measurements by CERN in accelerator environments LHC CesrTA SLS CMS CLEX ISR M. Sylte, M. Guinchard, A. Kuzmin, A. Slaathaug K.Artoos,CLIC CES WG, CERN, 16 February 2011
Very low frequency absolute measurements: S. Takeda et al. 1994 STS-2 K.Artoos,CLIC CES WG, CERN, 16 February 2011
Power Spectral Density LHC tunnel in operation K.Artoos,CLIC CES WG, CERN, 16 February 2011
Integrated R.M.S. displacements lateral vertical K.Artoos,CLIC CES WG, CERN, 16 February 2011
Averaging, window, histogram, color map 50 averages of 64 sec blocks with 66.7% overlap: • To have a good frequency resolution + definition of PSD • To “see” something within the noise Histogram But: it’s an average view R.Amirikas, A. Bertolini DESY 2005 Baklakov, Shiltsev et al. Fermilab 1997 K.Artoos,CLIC CES WG, CERN, 16 February 2011
Variation in time of integrated R.M.S. W. Bialowons et al. K.Artoos,CLIC CES WG, CERN, 16 February 2011
CoherenceMeasurements 1 km of optical fibre for synchronisation + timing and Data Transfer Parameters Sampling rate 256 Hz Block duration 64 s Average Lin – 50 Overlap 66.7 % 2 Muller-BBM MKII Analyzers 24 bit on 100 mV Low ADC noise Guralp CMG 40T x,y,z 2*800Vs/m 30 s -50 Hz ENDEVCO 86 K.Artoos,CLIC CES WG, CERN, 16 February 2011 PCB 393B31
LHC Measurements LHCDCUM 1000 ~ 80 m under ground Measurements: 0 1 2 3 4 5 6 7 8 9 10 12 20 30 38 54 108 198 306 412 509 604 706 960 (m) • Specificfeatures : • - Synchronousmeasurements • LHC systems in operation, night time • Multi-directional
Characteristics - Correlationfunction: - Cross spectral density: - Normalized spectral density between two measurements x(t) and y(t): • Power spectral density of the • relative motion d(t)=x1(t)-x2(t): C. Collette, ILC-CLIC LET Beam Dynamics Workshop (23-25 June 2009)
3D coherences d=960 m; filteredbetween 0.08 Hz and 0.5 Hz • Correlation in the lowfrequency range • Similar amplitudes in all directions • Higherfrequencies are dominated by local vibration sources C. Collette, ILC-CLIC LET Beam Dynamics Workshop (23-25 June 2009)
Joints between tunnel segments S. Takeda et al. 1996 K.Artoos,CLIC CES WG, CERN, 16 February 2011
Coherence Length Measurements Coherence Reference Geophone Measuring Geophone • Three measurements were provided: • Geophones side by side • Geophones 2.5 m away from each other • Geophones 4.8 m away from each other
Propagation of local technical noise in concrete floor: some initial tests Michael Guinchard & Ansten Slaathaug Reference geophone V E/W N/S 10 nm @ 1 Hz Mechanical Measurement Lab Ansten.Slaathaug@cern.ch 2010.03.31 18
Transfer function magnitude along sweep sine. Increasing distance • Transfer function magnitude between reference geophone and geophone at measured points Mechanical Measurement Lab Ansten.Slaathaug@cern.ch 2010.03.31 19
Results Experiment2 : Sine withfixedfrequencywith the shaker Goal: Test different concrete floors with an exact reproducible vibration source Vibration level change with distance (general = no excitation) Mechanical Measurement Lab Ansten.Slaathaug@cern.ch 2010.03.31 20
CMS YB0 motion measurement PSD of the signals Vertical direction Geophones Cooling system OFF PSD of the signals Beam direction
CMS HF structure motion measurement PSD of the signals Vertical direction Cooling system OFF Geophones PSD of the signals Beam direction
Interpretation • Technical noise is higher on top of experience at all frequencies. • Modal analysis is not easy: not enough sensors, not measured at same time, no good phase measurements because low signal to noise ratio, not known excitation,... • Refer to work of Hiroshi Yamaoka KEK, BELLE K.Artoos,CLIC CES WG, CERN, 16 February 2011
CMS slab measurements K.Artoos,CLIC CES WG, CERN, 16 February 2011
First measurements on CMS slab Vertical Transfer function (reference seismometer above rail) Vertical Transfer function (reference seismometer on floor) K.Artoos,CLIC CES WG, CERN, 16 February 2011
Second measurements K.Artoos,CLIC CES WG, CERN, 16 February 2011
Conclusions • Micro seismic wave (0.1 to 0.25 Hz, 0.1 to 3 micron integrated R.M.S.) Depends on weather conditions + geology (ref. G.E. Fischer) • Micro seismic wave does not depend on tunnel depth • Technical noise from surface decreases with depth of tunnel • Technical noise varies in time. Day night variations of factor 5 on surface and factor 2 for deep tunnels. (ref. measurements DESY) • Only low frequency ground motion is coherent over long distances. At and above one Hz the ground motion is coherent to maximum 40 m on a continuous concrete floor. • Local vibration sources are attenuated by the concrete floor over some distance. It would be good to characterize different concretes. • A particle detector is “noisy”, even during “quiet” conditions. • The CMS slab amplifies ground motion, mechanism not entirely clear K.Artoos,CLIC CES WG, CERN, 16 February 2011