Download
1 / 30
320 likes | 444 Views
Center for Biofilm Engineering. Experimental design and statistical analysis of in vitro models of oral biofilms. Al Parker, Biostatistician. July, 2012. What is statistical thinking?. Data/Response Experimental Design Uncertainty assessment. What is statistical thinking?.

E N D
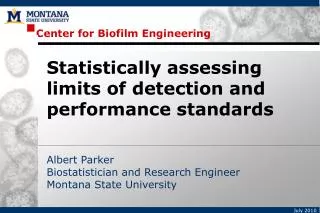
Center for Biofilm Engineering Experimental design and statistical analysis of in vitro models of oral biofilms Al Parker, Biostatistician July, 2012
What is statistical thinking? • Data/Response • Experimental Design • Uncertainty assessment
What is statistical thinking? • Data/Response (pixel intensity in an image? • log(cfu) from viable plate counts?) • Experimental Design • - controls • - randomization • - replication (How many coupons? experiments? technicians? labs?) • Uncertainty and variability assessment
Why statistical thinking? • Anticipate criticism (design method and experiments accordingly) • Provide convincing results (establish statistical properties) • Increase efficiency (conduct the least number of experiments) • Improve communication
in vitro testing Why statistical thinking?
Attributes of an in vitro method: Seven R’s • Relevance • Reasonableness • Ruggedness • Responsiveness • Reproducibility (inter-laboratory) • Resemblance • Repeatability (intra-laboratory reproducibility) • http://www.biofilm.montana.edu/content/ksa-sm-03
Attributes of an in vitro method: Seven R’s • Relevance • Reasonableness • Ruggedness • Responsiveness • Reproducibility (inter-laboratory) • Resemblance • Repeatability (intra-laboratory reproducibility)
Resemblance Independent repeats of the same experiment in the same laboratory produce nearly the same control data, as indicated by a small repeatability standard deviation, CSr = STDEV(Mean Controls for each experiment) http://www.biofilm.montana.edu/content/ksa-sm-10
Resemblance Example ASTM E2647 Drip Flow Reactor • Low shear • Plug flow
Resemblance Example 4 slides or coupons • Experimental Design: • saliva collected from volunteers • 4 day old supragingivalbiofilms • Both saline and treatment • applied for 1 minute • 5 independent experimental runs control treated (sterile saline) (Chlorhexidinedigluconate 0.12%)
Resemblance Example Data: log10(cfu/cm2) from viable plate counts Density LD Couponcfu/cm2log(cfu/cm2) 12.3 x 10⁸ 8.36 21.7 x 10⁸ 8.23 ControlLD= 8.29
Resemblance from experiment to experiment Summary Statistics: 1. Mean ControlLD = 7.81 the best guess for the true mean control LD 2.CSr=STDEV(ControlLDs) =0.32 the typical distance between the ControlLD for a single experiment and the true mean control LD log10 (cfu/cm2) CSr is not STDEV(LDs)
Resemblance from experiment to experiment The variance CSr2 can be partitioned: 84% due to among experiment sources 16% due to within experiment sources log10 (cfu/cm2)
Estimating the true mean control LD with confidence 1.Start with your best guess: Mean ControlLD 2. Calculate the SE of Mean ControlLD, using: CS2c= within-experiment variance of control coupon LD CS2E= among-experiments variance of control coupon LD nc= number of control coupons per experiment m = number of experiments 2 2 CS CS E c SE of Mean ControlLD= CSr/ = + m nc • m m 3.CI for the true mean control LD= Mean ControlLD± tm-1 x SE
Estimating the true mean control LD with confidence 1. Mean ControlLD = 7.81 2. Calculate the SE of Mean ControlLD: CS2c = 0.16 x (.32)2= 0.03211 CS2E = 0.84 x(.32)2= 0.08544 nc= 2 m = 5 0.08544 0.03211 = 0.1425 SE of Mean ControlLD= + 5 2 • 5 3. A 95% CI for true mean control LD = 7.81 ± 2.78 x 0.1425 = 7.81 ± 0.33 = (7.41, 8.20)
Estimating the true mean control LD with confidence We are 95% confident that the true mean of the control LDs is in this interval log10 (cfu/cm2)
Attributes of an in vitro method: Seven R’s • Relevance • Reasonableness • Ruggedness • Responsiveness • Reproducibility (inter-laboratory) • Resemblance • Repeatability (intra-laboratory reproducibility)
Repeatability Independent repeats of the same experiment in the same laboratory produce nearly the same response, as indicated by a small repeatability standard deviation Sr = STDEV(Mean response for each experiment) http://www.biofilm.montana.edu/content/ksa-sm-10
Repeatability Example 4 slides or coupons control treated (saline) (Chlorhexidinedigluconate 0.12%)
Repeatability Example Data/Response:log reduction (LR) LR = mean(control LDs) – mean(treated LDs)
Repeatability Example Since there is no obvious pairing between the controls and treated coupons in each experiment, get 1 LR for each experiment Mean LR = 1.87
Repeatability Example Summary Statistics: 1. Mean LR = 1.87 the best guess for the true mean LR 2.Sr = STDEV(LRs) = 0.69 the typical distance between the LR for a single experiment and the true mean LR
Estimating the true mean LR with confidence 1.Start with your best guess:Mean LR 2. Calculate the SE of Mean LR, using: S2c= within-experiment variance of control coupon LD S2d= within-experiment variance of treated coupon LD S2E= among-experiment variance of LR nc= number of control coupons per experiment nd = number of treated coupons per experiment m = number of experiments 2 2 2 S S S E d c m SE of mean LR = Sr/ = + + m nd• m nc • m 3. CI for the true mean LR= Mean LR± tm-1 x SE
Estimating the true mean LR with confidence 1.Mean LR = 1.87 2. Sc2= 0.03211 Sd2= 0.82092 SE2 = 0.06219 nc= 2, nd= 2, m = 5 0.06219 0.03211 0.82092 SE of mean LR = = 0.309 + + 5 2 • 5 2 • 5 3. 95% CI for true mean LR = 1.87± 2.78 x 0.309 =1.87± 0.8580 = (1.01, 2.73)
Estimating the true mean LR with confidence We are 95% confident that the true mean LR is in this interval
How many coupons? experiments? 0.06219 0.03211 0.82092 + + margin of error= tm-1 x m nd • m nc • m
Summary • Even though biofilms are complicated, it is feasible to develop • in vitromethods that meet the “Seven R” criteria. • Good experiments use controls, randomization where possible, and • sufficient replication. • Assess uncertainty by reporting CIs. • To reduce uncertainty, invest effort in conducting moreexperiments • instead of using more coupons in a single experiment. • For additional statistical resources for biofilm methods, check out: • http://www.biofilm.montana.edu/category/documents/ksa-sm