Download
1 / 22
220 likes | 342 Views
The Measured Performance of Content Distribution Networks. Kirk Johnson John Carr Mark Day Frans Kaashoek. Overview. Background Procedure Results Discussion. What? And Why?. Content distribution networks are coordinated caching systems.

E N D
The Measured Performance of Content Distribution Networks Kirk Johnson John Carr Mark Day Frans Kaashoek
Overview • Background • Procedure • Results • Discussion
What? And Why? • Content distribution networks are coordinated caching systems. • CDNs are a multi-million-dollar business already. • We’d like to have a figure of merit for them. • This talk doesn’t have that figure of merit… • …but it has some better data than just counting servers in networks
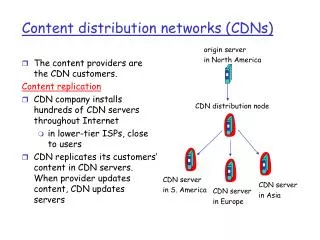
Network Model HTTP server example.com ? A B HTTP server B GET http://example.com/foo HTTP server C A DNS-redirecting CDN DNS redirector Client http://example.com/foo
Client Actions • R: Resolve domain name • F: Fetch content • Ordinary client use of CDN: RF • Instead of doing (RF)+ we do R+ then F+ • This allows us to compare the server chosen to some other servers that could have been chosen, over a large number of fetches.
Procedure • R+: Collect a set of servers by repeated DNS queries • to a variety of name servers • over a number of hours • F+: Fetch a particular piece of content from each member of the set, measuring latency
Important Details • Interleaved fetches • Fetch1 at server1, fetch1 at server2, etc. • Not fetch1 at server1, fetch2 at server1, etc. • Unmeasured fetch before measured fetch • Avoids cache misses • Measure only HTTP fetch latency • CDN not penalized for cost of DNS resolution
Caveats • Can’t compare Akamai and DI directly • The experiments fetched different-sized data (4672 vs. 3772 bytes) • on different days • This is not the definitive CDN-measuring paper • Just some interesting indicators of what’s out there
Looking at these graphs • Note: log plot of latency • Gray line: cumulative distribution at one server • Red line: cumulative distribution at all servers • Blue line: cumulative distribution at CDN
Cumulative Distribution • Right way to look at this data • Want to understand frequency and magnitude of bad choices • Consistent = vertical • Fast = to the left
Akamai observations • Not optimal • Does especially well in location B (Cambridge) • Does only a fair job in location C (Boulder)
Akamai observations • Not optimal • Does especially well in location B (Cambridge) • Does only a fair job in location C (Boulder)
Digital Island Akamai observations • Not optimal • Does especially well in location B (Cambridge) • Does only a fair job in location C (Boulder) Y Z
Conclusions • CDNs do add measurable value compared to random selection • They aren’t perfect or optimal • You can measure them yourself! • Hard to know what explains performance differences • Internal structures are secret