Download
1 / 1
10 likes | 93 Views
Role of the spleen in leukemogenesis induced by bovine leukemia virus. 3 weeks after CFSE injection. Before CFSE injection. 15 minutes after CFSE injection. 2 days after CFSE injection. 68.6%. 94.5%. 5.5%. 31.4%. < 0 . 1 %. 25.7%. 7 4. 3 %. 100%. Before splenectomy.

E N D
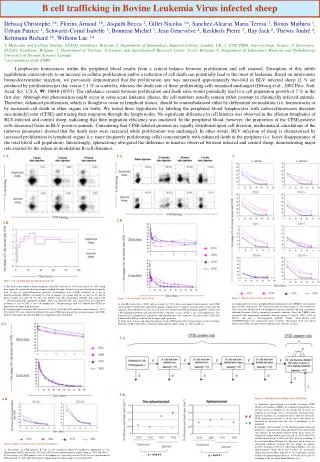
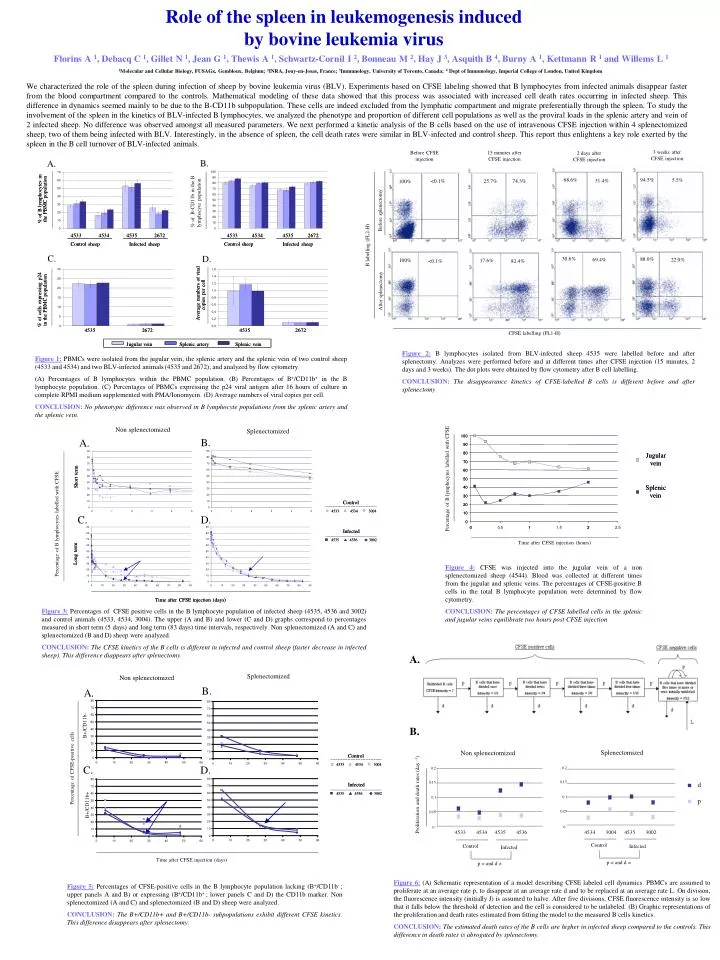
Role of the spleen in leukemogenesis induced by bovine leukemia virus 3 weeks after CFSE injection Before CFSE injection 15 minutes after CFSE injection 2 days after CFSE injection 68.6% 94.5% 5.5% 31.4% <0.1% 25.7% 74.3% 100% Before splenectomy B labelling (FL2-H) 30.6% 88.0% 69.4% 22.0% 100% 17.6% <0.1% 82.4% After splenectomy CFSE labelling (FL1-H) Figure 2: B lymphocytes isolated from BLV-infected sheep 4535 were labelled before and after splenectomy. Analyzes were performed before and at different times after CFSE injection (15 minutes, 2 days and 3 weeks). The dot plots were obtained by flow cytometry after B cell labelling. CONCLUSION:The disappearance kinetics of CFSE-labelled B cells is different before and after splenectomy 100 90 80 Control Control Control Control 70 60 4533 4533 4533 4533 4534 4534 4534 4534 3004 3004 3004 3004 50 40 Infected Infected Infected Infected 30 4535 4535 4535 4535 4536 4536 4536 4536 3002 3002 3002 3002 20 10 0 0 0.5 1 1.5 2 2.5 0.2 0.15 0.1 0.05 0 Florins A 1, Debacq C 1, Gillet N 1, Jean G 1, Thewis A 1, Schwartz-Cornil I 2, Bonneau M 2, Hay J 3, Asquith B 4, Burny A 1, Kettmann R 1 and Willems L 1 1Molecular and Cellular Biology, FUSAGx, Gembloux, Belgium; 2INRA, Jouy-en-Josas, France; 3Immunology, University of Toronto, Canada; 4 Dept of Immunology, Imperial College of London, United Kingdom We characterized the role of the spleen during infection of sheep by bovine leukemia virus (BLV). Experiments based on CFSE labeling showed that B lymphocytes from infected animals disappear faster from the blood compartment compared to the controls. Mathematical modeling of these data showed that this process was associated with increased cell death rates occurring in infected sheep. This difference in dynamics seemed mainly to be due to the B-CD11b subpopulation. These cells are indeed excluded from the lymphatic compartment and migrate preferentially through the spleen. To study the involvement of the spleen in the kinetics of BLV-infected B lymphocytes, we analyzed the phenotype and proportion of different cell populations as well as the proviral loads in the splenic artery and vein of 2 infected sheep. No difference was observed amongst all measured parameters. We next performed a kinetic analysis of the B cells based on the use of intravenous CFSE injection within 4 splenectomized sheep, two of them being infected with BLV. Interestingly, in the absence of spleen, the cell death rates were similar in BLV-infected and control sheep. This report thus enlightens a key role exerted by the spleen in the B cell turnover of BLV-infected animals. B. A. % of B-CD11b in the B lymphocyte population % of B lymphocytes in % of B lymphocytes in the PBMC population the PBMC population 4533 4533 4534 4534 4535 4535 2672 2672 4533 4533 4534 4534 4535 4535 2672 2672 Control sheep Control sheep Infected sheep Infected sheep Control sheep Control sheep Infected sheep Infected sheep C. D. Average numbers of viral Average numbers of viral copies per cell copies per cell % of cells expressing p24 % of cells expressing p24 in the PBMC population in the PBMC population 4535 4535 2672 2672 4535 4535 2672 2672 Jugular vein Jugular vein Splenic artery Splenic artery Splenic vein Splenic vein Figure 1: PBMCs were isolated from the jugular vein, the splenic artery and the splenic vein of two control sheep (4533 and 4534) and two BLV-infected animals (4535 and 2672); and analyzed by flow cytometry. (A) Percentages of B lymphocytes within the PBMC population. (B) Percentages of B+/CD11b+ in the B lymphocyte population. (C) Percentages of PBMCs expressing the p24 viral antigen after 16 hours of culture in complete RPMI medium supplemented with PMA/Ionomycin. (D) Average numbers of viral copies per cell. CONCLUSION:No phenotypic difference was observed in B lymphocyte populations from the splenic artery and the splenic vein. Non splenectomized Splenectomized B. A. 100 90 80 Jugular Jugular vein vein 70 60 Short term Short term Percentage of B lymphocytes labelled with CFSE 50 Splenic Splenic 40 vein vein 30 20 C. D. 10 0 Percentage of B lymphocytes labelled with CFSE 0 1 2 Time after CFSE injection (hours) Long term Long term Figure 4: CFSE was injected into the jugular vein of a non splenectomized sheep (4544). Blood was collected at different times from the jugular and splenic veins. The percentages of CFSE-positive B cells in the total B lymphocyte population were determined by flow cytometry. CONCLUSION:The percentages ofCFSE labelled cells in the splenic and jugular veins equilibrate two hours post CFSE injection Time after CFSE injection (days) Time after CFSE injection (days) Figure 3: Percentages of CFSE positive cells in the B lymphocyte population of infected sheep (4535, 4536 and 3002) and control animals (4533, 4534, 3004). The upper (A and B) and lower (C and D) graphs correspond to percentages measured in short term (5 days) and long term (83 days) time intervals, respectively. Non splenectomized (A and C) and splenectomized (B and D) sheep were analyzed. CONCLUSION: The CFSE kinetics of the B cells is different in infected and control sheep (faster decrease in infected sheep). This difference diappears after splenectomy. A. Splenectomized Non splenectomized B. A. B. B+/CD11b- Splenectomized Non splenectomized 0.2 C. D. Percentage of CFSE-positive cells 0.15 d Proliferation and death rates (day –1) 0.1 p B+/CD11b+ 0.05 0 4533 4534 4535 4536 4534 3004 4535 3002 Control Control Infected Infected p = and d = p = and d ≠ Time after CFSE injection (days) Figure 6: (A) Schematic representation of a model describing CFSE labeled cell dynamics. PBMCs are assumed to proliferate at an average rate p, to disappear at an average rate d and to be replaced at an average rate L. On division, the fluorescence intensity (initially J) is assumed to halve. After five divisions, CFSE fluorescence intensity is so low that it falls below the threshold of detection and the cell is considered to be unlabeled. (B) Graphic representations of the proliferation and death rates estimated from fitting the model to the measured B cells kinetics. CONCLUSION:The estimated death rates of the B cells are higher in infected sheep compared to the controls. This difference in death rates is abrogated by splenectomy. Figure 5: Percentages of CFSE-positive cells in the B lymphocyte population lacking (B+/CD11b- ; upper panels A and B) or expressing (B+/CD11b+ ; lower panels C and D) the CD11b marker. Non splenectomized (A and C) and splenectomized (B and D) sheep were analyzed. CONCLUSION:The B+/CD11b+ and B+/CD11b- subpopulations exhibit different CFSE kinetics. This difference disappears after splenectomy.