Download
1 / 33
330 likes | 436 Views
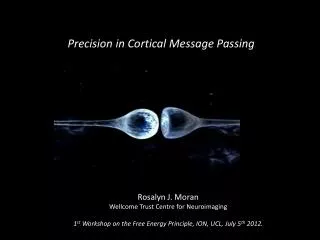
Dynamic Causal Modelling for Cross Spectral Densities. Rosalyn Moran Virginia Tech Carilion Research Institute. Outline. DCM & Spectral Data Features (the Basics) DCM for CSD vs DCM for SSR DCM for CSD Example. Outline. DCM & Spectral Data Features (the Basics)

E N D
Dynamic Causal Modelling for Cross Spectral Densities Rosalyn Moran Virginia Tech Carilion Research Institute
Outline DCM & Spectral Data Features (the Basics) DCM for CSD vs DCM for SSR DCM for CSD Example
Outline DCM & Spectral Data Features (the Basics) DCM for CSD vs DCM for SSR DCM for CSD Example
Dynamic Causal Modelling: Generic Framework Electromagnetic forward model:neural activity EEGMEG LFP Time Domain ERP Data Phase Domain Data Time Frequency Data Steady State Frequency Data Hemodynamicforward model:neural activity BOLD Time Domain Data Cross Spectral Densities (Frequency Domain) Neural state equation: EEG/MEG fMRI complicated neuronal model Fast time scale simple neuronal model Slow time scale
Dynamic Causal Modelling: Generic Framework “theta” Electromagnetic forward model:neural activity EEGMEG LFP CSDs Hemodynamicforward model:neural activity BOLD Time Domain Data Power (mV2) Frequency (Hz) Neural state equation: EEG/MEG fMRI complicated neuronal model Fast time scale simple neuronal model Slow time scale
Dynamic Causal Modelling: Framework Empirical Data Hemodynamicforward model: Electromagnetic forward model: Neural state equation: EEG/MEG fMRI Generative Model Bayesian Inversion complicated neuronal model simple neuronal model Model Structure/ Model Parameters
Dynamic Causal Modelling: Framework Bayes’ rules: Free Energy: max Inference on models Inference on parameters Bayesian Inversion Model 1 Model 2 Model 1 Model comparison via Bayes factor: accounts for both accuracy and complexity of the model allows for inference about structure (generalisability) of the model
Dynamic Causal Modelling: Framework Bayes’ rules: Free Energy: max Inference on parameters Inference on models Bayesian Inversion Model 1 Model 2 Model 1 Model comparison via Bayes factor: accounts for both accuracy and complexity of the model allows for inference about structure (generalisability) of the model
Dynamic Causal Modelling: Neural Mass Model inhibitory interneurons spiny stellate cells Pyramidal Cells EEG/MEG/LFP signal Properties of tens of thousands of neurons approximated by their average response Intrinsic Connections neuronal (source) model Internal Parameters Extrinsic Connections State equations
Dynamic equations mimic physiology and produce electrophysiological responses Neurotransmitters: Glu/GABA • AMPA receptors • GABAa receptors A Neural Mass Model (6) layer cortical regions) State equations: A dynamical systems description of anatomy and physiology Extrinsic Connections Supragranular Pyramidal Cells + inhibitory interneurons Intrinsic Connections spiny stellate cells Internal Parameters Eg. Time constants of Sodium ion channels Deep Pyramidal Cells + inhibitory interneurons
synapses AP generation zone AP generation zone Dynamics mimicked at AMPA and GABA receptors Neurotransmitters: Glu/GABA Cortico-cortical connection • AMPA receptors Supragranular Layer: Inhibitory Cells • GABAa receptors Intrinsic Connection Granular Layer: Excitatory Cells Infragranular Layer: Pyramidal Cells Cortico-cortical connection
synapses AP generation zone Parameters quantify contributions at AMPA and GABA receptors Neurotransmitters: Glu/GABA • AMPA receptors Supragranular Layer: Inhibitory Cells • GABAa receptors Intrinsic Connection Granular Layer: Excitatory Cells Infragranular Layer: Pyramidal Cells Cortico-cortical connection
State equations in a 6 layer cortical model Extrinsic lateral connections inhibitory interneurons Extrinsic forward connections spiny stellate cells Intrinsic connections pyramidal cells Extrinsic backward connections
State equations to Spectra Transfer Function Frequency Domain State Space Characterisation Time Differential Equations Linearise mV Moran, Kiebel, Stephan, Reilly, Daunizeau, Friston (2007) A neural mass model of spectral responses in electrophysiology.NeuroImage
g 5 g g g 4 3 3 = & x x 1 4 = k g - + - k - k 2 & H ( s ( x a ) u ) 2 x x x 4 1 9 4 1 e e e e g g g 1 2 2 Given an empirical recording: estimate parameters of the model • GABAa receptor density • AMPA receptor density Superficial layers Measurement Increased activity at GABA receptors in supragranular layers GABA release Granular layers Excitatory spiny cells in granular layers 1.4 16 1.3 1.4 L-Dopa Placebo 14 1.3 1.2 Normalised Power (a.u.) Deep layers 1.2 12 Glutamate release 1.1 Normalised Power (a.u.) 1.1 10 1 1 Frequency (Hz) 8 0.9 0.9 6 0.8 0.8 4 0.7 0 2 4 6 8 10 12 14 16 18 0.7 2 Frequency (Hz) • GABAa TC 800 0 6 11 16 • AMPA time constant Frequency (Hz) Bayesian Inversion Predicted response (Pyramidal Cell Depolarization) Moran, Stephan, Seidenbecher, Pape, Dolan, Friston (2009) Dynamic Causal Model of Steady State Responses. NeuroImage Friston, Bastos, Litvak, Stephan, Fries, Moran (2012) DCM for complex data: cross-spectra, coherence and phase-delays. NeuroImage
A conductance model offers more biological plausibility Neuromodulators: Acetylcholine/Dopamine Superficial layers Neurotransmitters: Glu/GABA Sodium Channel Chloride Channel Granular layers Potassium Channel Deep layers Depolarization dependent Calcium Channel AMPA/NMDA Ratio higher in Prefrontal Regions than Parietal Regions 1.4 f 1.4 1.3 = 1.3 NMDA mediated switch 1.2 Mg 1.2 1.1 1.1 1 Normalised Power (a.u.) Frequency (Hz) 8 1 0.9 6 0.8 0.9 4 0.7 0 2 4 6 8 10 12 14 16 18 0.8 2 Frequency (Hz) Normalised Power (a.u.) 800 0.7 0 6 11 16 Frequency (Hz) Moran, Stephan, Dolan, Friston (2011) Consistent Spectral Predictors for Dynamic Causal Models of Steady State Responses. NeuroImage
Extract Data Features Specify model Maximise the model evidence (~-F) Find your experimental data Test models or MAP parameters Roadmap
Summary: DCM for Steady State Responses Prediction Prediction Generative Model Prediction | H2(ω) . H2*(ω) | | H1(ω) . H1*(ω) | dx/dt = Ax + B | H1(ω) . H2*(ω) | Cortical Macrocolumns and free parameters
Summary: DCM for Steady State Responses Model Inversion | H2(ω) . H2*(ω) | | H1(ω) . H1*(ω) | dx/dt = Ax + B | H1(ω) . H2*(ω) | Cortical Macrocolumns and free parameters
Outline DCM & Spectral Data Features (the Basics) DCM for CSD vs DCM for SSR DCM for CSD Example
Time to Frequency Domain Linearise around a stable fixed point or LC DCM for SSR DCM for CSD
DCM for Cross Spectral Densities Prediction Prediction Generative Model Prediction H2(ω) . H2*(ω) H1(ω) . H1*(ω) Spectra and Phase lag Coherence Cross Correlations dx/dt = Ax + B H1(ω) . H2*(ω) Cortical Macrocolumns and free parameters
DCM for Cross Spectral Densities Prediction Prediction Model Inversion using full complex signal Prediction H2(ω) . H2*(ω) H1(ω) . H1*(ω) Spectra and Phase lag Coherence Cross Correlations dx/dt = Ax + B H1(ω) . H2*(ω) Cortical Macrocolumns and free parameters
F Real and imaginary errors Real and imaginary derivatives wrtfx, G E: M: Accommodating Imaginary Numbers
Extract Data Features Maximise the model evidence (~-F) Specify model Test models or MAP parameters Find your experimental data And also report phase lags coherence & delays In channel or source space Roadmap Interface Additions New CSD routines, similar to SSR SPM_NLSI_GN accommodates imag numbers, slopes, curvatures A host of new results features, in channel and source space!
Conditional Estimates: Spectral Power mode 2 to 1 mode 1 to 1 18 18 16 16 14 14 Abs(H1(ω) . H1*(ω)) Abs(H1(ω) . H2*(ω)) Abs(H2(ω) . H1*(ω)) Abs(H2(ω) . H2*(ω)) 12 12 10 10 8 8 6 6 Power 4 4 2 2 0 0 10 20 30 40 10 20 30 40 frequency Hz frequency Hz mode 2 to 2 Spectral density over modes predicted: trial 1 18 (in channel-space) observed: trial 1 16 predicted: mode 1 observed: mode 1 14 15 predicted: mode 2 observed: mode 2 12 Hipp 10 abs(CSD) 10 8 5 PFC 6 4 0 10 20 30 40 2 frequency (Hz) 0 10 20 30 40 frequency Hz
Conditional Estimates: Coherence |(H1(ω).H2*(ω))|2 ______________________ {(H1(ω).H1*(ω)) + (H2(ω).H2*(ω))} Coh: pfc to hipp Channels: 2 to 1 1 1 0.9 1 0.8 1 0.7 0.6 1 0.5 1 0.4 0.3 1 0.2 1 0.1 Hipp 0 1 0 10 20 30 40 50 0 10 20 30 40 50 PFC frequency Hz frequency Hz predicted: trial 1 observed: trial 1
mode 1 to 1 mode 2 to 1 0.2 0.2 0.15 0.15 0.1 0.1 0.05 0.05 0 0 -0.05 -0.05 -100 -50 0 50 100 -100 -50 0 50 100 lag (ms) lag (ms) Auto-covariance 0.2 (in channel-space) 0.2 0.15 0.15 0.1 0.1 auto-covariance 0.05 0.05 0 0 -0.05 -100 -50 0 50 100 -0.05 Lag (ms) -100 -50 0 50 100 Conditional Estimates: Covariance F-1(H1(ω).H1*(ω)) F-1(H1(ω).H2*(ω)) F-1(H2(ω).H1*(ω)) F-1(H2(ω).H2*(ω)) mode 2 to 2 trial 1 channel 1 channel 2 Hipp PFC lag (ms)
Conditional Estimates: Delays arg(H1(ω).H2*(ω)) ____________ ω Delay (ms) PfC to Hipp Delay (ms) 2 to 1 10 5 trial 1 predicted: trial 1 observed: trial 1 5 0 0 -5 -5 -10 -10 -15 Hipp -15 PFC -20 -20 -25 -25 0 10 20 30 40 50 0 10 20 30 40 50 Frequency Hz frequency Hz
Outline DCM & Spectral Data Features (the Basics) DCM for CSD vs DCM for SSR DCM for CSD Examples
Pharmacological Manipulation of Glutamate and GABA • 4 levels of anaesthesia: each successively decreasing glutamate and increasing GABA • (Larsen et al Brain Research 1994; Lingamaneniet al Anesthesiology 2001; Caraiscoset al J Neurosci 2004 ; de Sousa et alAnesthesiology 2000 ) • LFP recordings from primary auditory cortex (A1) & posterior auditory field (PAF) • White noise stimulus & Silence A1 0.12 0.12 0.06 0.06 LFP 0 0 mV mV - - 0.06 0.06 A2 0.12 0.12 0.06 0.06 0 0 mV mV - - 0.06 0.06
Summary DCM for CSD: Suitable for long time series with trial-specific spectral features eg pronounced beta Fits complex spectral data features Offers similar connectivity estimates to DCM for ERPs With estimates of frequency specific delays and coherence Can be used with all biophysical, Neural Mass Models (CMC, LFP etc.)
Thank You Acknowledgments The FIL Methods Group Karl Friston DimitrisPinotsis Marco Leite Vladimir Litvak Jean Daunizeau Stephan Kiebel Will Penny Klaas Stephan Andre Bastos Pascal Fries