Download
1 / 30
300 likes | 368 Views
Biofuels & Energy Crops in Perspective. Melvyn F. Askew Head of Agricultural and Rural Strategy Central Science Laboratory Sand Hutton York UK YO41 1LZ. AONB 02OCT03 SLIDE 1. AONB 02OCT03 SLIDE 2. Outline of presentation - The European Perspective - Competitive Markets - Where Now?.

E N D
Biofuels & Energy Crops in Perspective Melvyn F. Askew Head of Agricultural and Rural Strategy Central Science Laboratory Sand Hutton York UK YO41 1LZ AONB 02OCT03 SLIDE 1
Outline of presentation - The European Perspective - Competitive Markets - Where Now? AONB 02OCT03 SLIDE 3
EU Energy Policy overall EU-15 policy statement two examples - white paper on energy - proposal for a fuels proposal AONB 02OCT03 SLIDE 4
ENERGY FOR THE FUTURE:RENEWABLE SOURCES OF ENERGY An EC White Paper for a Community Strategy and Action Plan AONB 02OCT03 SLIDE 5
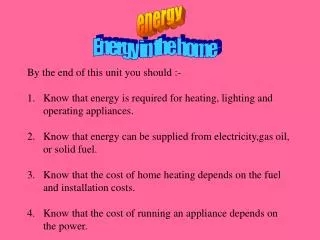
BACKGROUND DURING 1998 < 6% EU-15 gross energy consumption comes from renewable sources EU energy imports = 50% and rising Propose 12% renewables by 2010 AONB 02OCT03 SLIDE 6
Electricity generation • Agricultural wastes • Straw • manures • Domestic waste • Forestry waste • Dedicated energy crops • SRC • Energy grasses AONB 02OCT03 SLIDE 7
RENEWABLE RESOURCES BY EU MEMBER STATE 1990 1995 Austria 22.1 24.3 Belgium 1.0 1.0 Denmark 6.3 7.3 Finland 18.9 21.3 France 6.4 7.1 Germany 1.7 1.8 Greece 7.1 7.3 Ireland 1.6 2.0 Italy 5.3 5.5 Luxembourg 1.3 1.4 Netherlands 1.3 1.4 Portugal 17.6 15.7 Spain 6.7 5.7 Sweden 24.7 25.4 United Kingdom 0.5 0.7 European Union 5.0 5.3 AONB 02OCT03 SLIDE 8
Renewable Energy in EU : 2010 Type of Energy Share in the Projected Share EU in 1995 by 2010 1 Wind 2.5 GW 40 GW 2 Hydro 92 GW 105 GW 2.1 Large (82.5 GW) (91 GW) 2.2 Small (9.5 GW) (14 GW) 3 Photovoltaics 0.03 GWp 3 GWp 4 Biomass 44.8 Mtoe 135 Mtoe 5 Geothermal 5a Electric 0.5 GW 1 GW 5b Heat (incl. heat pumps) 1.3 GWTH 5 gwTH 6 Solar Thermal Collectors 6,5 Million m² 100 Million m² 7 Passive Solar 35 Mtoe 8 Other 1 GW AONB 02OCT03 SLIDE 9
Current and Projected Electricity Actual in 1995Projected for 2010 Type of EnergyTWh%of totalTWh% of total Total 2,366 2,870 (Pre-Kyoto) 1 Wind 4 0.2 80 2.8 2 Total hydro 307 13 355 12.4 2a Large (incl. (270) (300) pumped storage) 2b Small (37) (55) 3 Photovoltaics 0.03 - 3 0.1 4 Biomass 22.5 0.95 230 8.0 5 Geothermal 3.5 0.15 7 0.2 Total Renewable Energies 337 14.3 675 23.5 AONB 02OCT03 SLIDE 10
UK Electricity Generation (2002) Renewables Nuclear Coal Oil Gas UK Government Energy White Paper 2003 AONB 02OCT03 SLIDE 11
Short rotation coppice (SRC) 1% of UK electricity demand = 0.3 M ha SRC (125,000 ha more likely 2010 target for energy crops) 1 Mw = supply for 2500 homes Requires 6000 – 8000 t DM = 600-800 ha SRC AONB 02OCT03 SLIDE 12
Willow • Suited to wide range of soils (clay to sand) • Perennial – cut every 3 years • 7-8 metres tall • Tolerates flooding • Rainfall of 600-1000mm AONB 02OCT03 SLIDE 13
Miscanthus • Perennial energy and fibre crop – 4m tall • Annual harvest for 15-20 years • 13-15 t/ha/annum • Establishment grants £920/ha (40% of cost) AONB 02OCT03 SLIDE 14
AONB 02OCT03 SLIDE 15 Miscanthus • Most suited to maize growing areas – (typically lowlands south of Bristol and The Wash) • Not recommended for drought prone soils – likes deep moisture retentive soils • Limited risk of field escape • Low input
AONB 02OCT03 SLIDE 16 • Have you considered added value? • - “Holistic” approaches with other • local systems/needs • Peak energy generation • Selling kilowatts not kilograms • Heather; wastes; trees • Selling metabolites
AONB 02OCT03 SLIDE 17 Who needs to be involved? Heat/Energy generation - Local authorities (schools, hospitals, small housing estates) - Armed Services - Prison Service - National Trust - Forestry Commission - and……………..
AONB 02OCT03 SLIDE 18 EU-15 Liquid Biofuels Primarily biodiesel - almost 1 million tonnes in 2000
AONB 02OCT03 SLIDE 19 EU Liquid “renewable fuel options” Short - medium term = biofuels Long term = hydrogen
AONB 02OCT03 SLIDE 20 “Proposal” for measures to promote biofuels EC - Strategy for Security of Energy Supply - 20% substitution of road fuels by 2020
AONB 02OCT03 SLIDE 21 Steps to Introduce Biofuels 2% of all diesel and petrol by 2005 0.75% increments per year to 5.75% of all diesel and petrol by 2010
AONB 02OCT03 SLIDE 22 EU-15 : Liquid Biofuels Production Country Petroleum Petrol Diesel B/fuel B/fuel products (ktoe) (ktoe) (kt) (kt) consumption 1998 1999 (transport) (ktoe) Austria 5 923 2 130 3 224 16 298 France 47 237 14 554 26 063 319 344 Germany 61 351 30 080 24 834 100 130 Italy 38 647 17 880 16 138 96 96 Spain 29 401 9 018 16 215 / 50* Sweden 7 288 4 021 2 374 / 50* *production in the year 2000 Data sources : Eurostat
AONB 02OCT03 SLIDE 23 German biodiesel production(‘000 tonnes)
AONB 02OCT03 SLIDE 24 Meeting the 5.75% target Biofuel yield Feedstock % of (million tonnes) Area (‘000 ha) Current Waste oil 0.1 Rape oil (RME) 0.7 459 102% Wheat grain 0.4 173 11% S Beet 0.4 98 55% Wheat straw 0.25 164 10% SRC 0.2 100 - Miscanthus 0.5 229 - 2.55 M t 1.22 Million ha
AONB 02OCT03 SLIDE 25 REMEMBER COMPETITIONEG, OILS • Overall usage of vegetable oils and animal fats in the non-food sector of EU-15 is approximately 3 million tonnes per annum. • Bio-lubricants – the potential EU market is approximately 370,000 tonnes/annum. • Bio-printing inks - the EU market is in excess of 120,000 tonnes/annum. • Bio-solvents – the EU solvent market is approximately 4 million tonnes • Linoleum - the EC demand for linoleum is likely to rise to 56 million m2 by 2003.
AONB 02OCT03 SLIDE 26 ADDING VALUE REQUIRES CAREFUL THOUGHT • With bulk commodities agriculture will be a price taker with little or no chance to added value eg biodiesel feed wheat • But what of heather/bracken? • Value may be added in more specialist markets where some sort of vertical integration can be organised
AONB 02OCT03 SLIDE 27 WHICH MARKETS OFFER POTENTIAL CAPACITY FOR EXPOITATION Remember: • Marketplace does not necessarily mean profitability Remember: • Use existing crops fully; exploit new crops carefully
AONB 02OCT03 SLIDE 28 Energy crops: wider issues • Potential sites are subject to an environmental and archaeological consultation • Landscape – tall crops, block views – design to fit the landscape • Wildlife value is high esp in mixed cropping patterns (+ve for birds and mammals) • Public Access issues • Low inputs – fertiliser and agrochemicals • Sludge disposal
AONB 02OCT03 SLIDE 29 CONCLUSIONS • Good opportunities for energy products from agriculture exist but some are not yet ready for exploitation • Businesses and people differ - there is no universal answer • New enterprises or outlets do not necessarily mean extra income/profit - in some markets the farmer is a price taken • Partnership leads to success