Download
1 / 54
540 likes | 828 Views
Natural Gas Hydrate Transportation. David Mannel David Puckett. Contents . Hydrate Synthesis Hydrate Transportation Hydrate Dissociation Production Summary LNG Cost Estimation Economic Comparison. Hydrate Synthesis. Hydrate Synthesis.

E N D
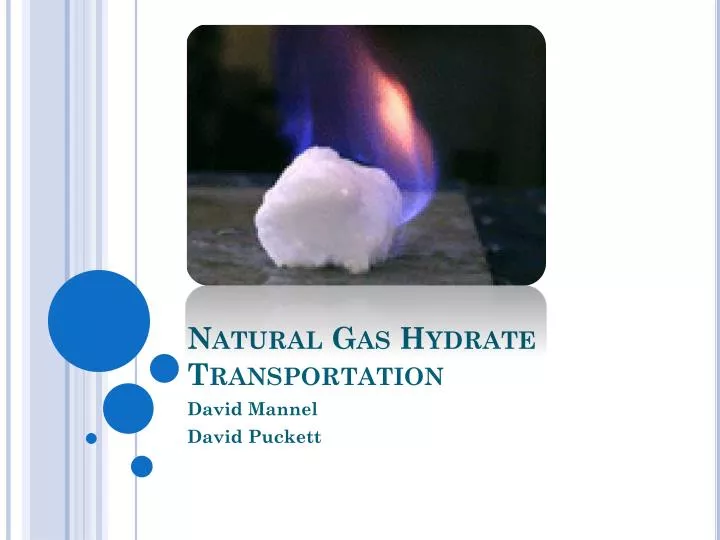
Natural Gas Hydrate Transportation David Mannel David Puckett
Contents • Hydrate Synthesis • Hydrate Transportation • Hydrate Dissociation • Production Summary • LNG Cost Estimation • Economic Comparison
Hydrate Synthesis Water content in hydrate slurry is frozen to form hydrate-ice blocks at 241 K. Blocks are then depressurized to 1 atm and handled in solid form. 7.47 mtpa, 14.7 psia, 241K 750 psia, 273K 1 mtpa, 750 psia, 388 K 6.47 mtpa, 750 psia, 298K 19.41 mtpa, 750 psia, 273K
Hydrate Synthesis • CSTR • For 1.5 mtpa methane production: • Vtotal=(3,130 mol CH4/s)/(1.29 mol/m3 * s) • Vtotal=2,430 m3 • 32 reactors used • Vreactor = 76 m3 Perry, R., & Green, D. (1997). Perry's Chemical Engineers' Handbook (7th ed.). McGraw-Hill.
Hydrate Synthesis • CSTR • Equipment Cost: • $1,760,000 Perry, R., & Green, D. (1997). Perry's Chemical Engineers' Handbook (7th ed.). McGraw-Hill.
Hydrate Synthesis • Compressors • Compressors sized using PRO II • Compressor Equipment Cost: • Recycle Compressor Cost: $2,200,000 • Intake Compressor Cost: $870,000 • Total Cost: $3,070,000 Perry, R., & Green, D. (1997). Perry's Chemical Engineers' Handbook (7th ed.). McGraw-Hill.
Hydrate Synthesis • Pumps • Pumps sized using P = HQη/3960 • H = 150ft • n = 74% • Q = 3,800 lb/s • Pump cost: • $690,000 Perry, R., & Green, D. (1997). Perry's Chemical Engineers' Handbook (7th ed.). McGraw-Hill.
Hydrate Synthesis • Heat Exchangers • Heat exchangers sized using: • Q=UA∆T • Heat exchanger cost based on area • Initial Cooling Heat Exchanger Area: 35,000 ft2 • Initial Cooling Heat Exchanger Cost: $235,000 • Post Cooling Heat Exchanger Area: 16,000 ft2 • Post Cooling Heat Exchanger Cost: $113,000 Perry, R., & Green, D. (1997). Perry's Chemical Engineers' Handbook (7th ed.). McGraw-Hill.
Hydrate Transportation • Capacity 145,000 metric tons • Capacity of 186,000 m3 • Length 290m • Beam 45m • Draught 18m • Base price $165,000,000 UNCTAD, S. (2007). Review of Maritime Transport. New York and Geneva: United Nations.
Hydrate Transportation - Slurry • Slurry Transport Advantages • Faster loading and unloading (8400 – 14000 tons per hour). • Ease of handling hydrate as fluid. • Slurry Transport Disadvantages • Loss of ship capacity to anti-freezing agents (4% - 5% of cargo weight). • Additional equipment required to remove anti-freezing agents from gas.
Hydrate Transportation - Solid • Solid Transport Advantages • Simplified regasification facility. • Slightly more capacity per ship than with slurry (4% - 5%). • Solid Transport Disadvantages • Slower loading and unloading (2000 – 4000 tons per hour). • Additional solid handling equipment required.
Hydrate Transportation Slurry handling is the best option for shipping distances of 2500 miles or less. Solid handling is the best option for shipping distances of 3500 miles or more.
Hydrate Transportation • Hydrate is stored in ship at equilibrium with either temperature or pressure. • The two limiting conditions are 1 atm of pressure at 241 K or 85 atm of pressure at 285 K. • Determinants of optimum pressure and temperature are cost and weight of steel required in hydrate storage vessel.
Hydrate Transportation • Faupel formula used to determine minimum steel thickness necessary for hydrate storage vessel. Minimum Bursting Pressure = (2/√3)*Yield Tensile Strength*ln(Ratio of Inner and Outer Diameters) • 1020 carbon steel used. • Yield tensile strength of 1020 carbon steel is 350 Mpa.
Hydrate Transportation 0.31m Ambient Temperature Tank Outer Diameter 29.5 m Tank Thickness 0.31m Steel Weight (if full length of vessel) 113000 tons 29.5m
Hydrate Transportation 3.65mm Atmospheric Pressure Tank Outer Diameter 29.5 m Tank Thickness 3.65mm Steel Weight (if full length of vessel) 1300 tons 29.5m
Hydrate Transportation • Shipping cost for 1.5 mtpa and distance of 4000 miles. • Shipping at ambient temperature (FCI): • $2,050,000,000 • Shipping at atmospheric pressure (FCI): • $1,100,000,000
Hydrate Transportation Ballast Inner Membrane Inner Hull Insulation Outer Membrane Ballast
Hydrate Transportation 3585 40 ton ice-hydrate blocks required
Hydrate Transportation • Refrigeration can be used to prevent hydrate dissociation. • With 4” of polyurethane insulation and a well-sealed cargo hold, 1.5 tons of refrigeration are required. • Cost of refrigeration • $6,300
Hydrate Dissociation • Pressure Vessel size based on required production level of natural gas. • For 1.5 mtpa capacity. • 44 pressure vessels: • V = 294 m3 • $5,400,000 • 776 storage vessels: • V = 150 m3 • $30,000,000 Perry, R., & Green, D. (1997). Perry's Chemical Engineers' Handbook (7th ed.). McGraw-Hill.
Hydrate Dissociation • Heating Costs for the kettle • Found using the heat of dissociation of methane hydrates, the specific heats of hydrate and water, and the required gas flow rate. • Cost of 1 MM BTU assumed to be $7.33 • Total heating cost • $40,000,000 Rueff, R. M., Sloan, E. D., & Yesavage, V. F. (1988). Heat Capacity and Heat of Dissociation of Methane Hydrates. AIChE Journal , 1468-1476.
Production Summary • The natural gas hydrates are produced in a stirred tank reactor. • The hydrates are frozen into blocks and loaded onto ships. • The ships have small refrigeration units to keep the blocks frozen. • The ships are at atmospheric pressure
Production Summary • The blocks of hydrates are decomposed in a pressurized vessel. • The hydrate leaves the vessel at pipeline pressure.
LNG Cost Estimation • Cost data for LNG was obtained at plant capacities of 1 mtpa, 2 mtpa, and 3.5 mtpa.
LNG Cost Estimation • Costs are taken as the average costs for a range of plant designs.
LNG Cost Estimation • Shipping costs are contracted out at $65,000/day for 57,000 tons LNG. • The total annualized cost for a LNG tanker is less than $23,000,000/year, or $63,000/day. • Contracting out the shipping is the worse case scenario for LNG. UNCTAD, S. (2007). Review of Maritime Transport. New York and Geneva: United Nations.
Economic Comparison • The TAC per ton of methane produced is plotted against capacity in tons.
Economic Comparison • 0 miles shows the TAC per ton that comes from the production and regasification plants. Production Regasification
Economic Comparison • Distance from Algeria to Cove Point, Maryland is about 4000 miles. • TAC per ton is shown for 1000 – 5000 miles.
Increasing distance increases the TAC/ton. Adding ships causes a sharp increase in TAC/ton.
LNG has a lower TAC/ton for transportation distances greater than 0 miles.
Increasing transportation distance increases the difference in the TAC/ton for LNG and NGH.
Economic Comparison • The cost of shipping LNG is less than the shipping cost for NGH. • LNG has a higher energy density than NGH. • 1 ton LNG = 1 ton natural gas • 1 ton hydrate = 0.134 tons natural gas and 0.866 tons water. • NGH requires 7 times the shipping weight of LNG.
Economic Comparison For 1.5 mtpa transported 4000 miles
Economic Comparison • The FCI per ton of natural gas is plotted against the capacity in tons. • 0 miles shows the FCI for the production and regasification plants.
FCI/ton increases with transportation distance. Adding ships produces a large increase in FCI/ton.
Economic Comparison • The ROI is found by dividing the profit by the TCI. • The TCI is found by assuming that TCI=FCI+WC=FCI/0.85 • The profit is taken as sales-cost-depreciation, or sales-TAC. • Sales is varied between $0 and $200 per ton of methane
Economic Comparison • ROI is found by: • ROI=((Sales-TAC)/TCI)*(ton/ton) • ROI=(Sales/ton-TAC/ton)/(TCI/ton) • ROI=((Sales/ton)/(TCI/ton))-((TAC/ton)/(TCI/ton)) • (TCI/ton) and (TAC/ton) have already been calculated, therefore (Sales/ton) is only thing to vary.
A positive ROI occurs with sales of $100/ton for low production capacities.
As distance increases the sales increases to $180/ton to maintain a positive ROI.
As distance increases the sales increases to slightly above $120/ton to maintain a positive ROI.