Download
1 / 63
650 likes | 943 Views
The Hidden Power of Social Networks: Developing Knowledge Maps Using Social Network Analysis. Dr. Jay Liebowitz Professor Graduate Division of Business and Management Johns Hopkins University jliebow1@jhu.edu. Sharing Knowledge is Power?! (December 10, 2004).

E N D
The Hidden Power of Social Networks: Developing Knowledge Maps Using Social Network Analysis Dr. Jay Liebowitz Professor Graduate Division of Business and Management Johns Hopkins University jliebow1@jhu.edu
“How to Battle the Coming Brain Drain”(Anne Fisher, Fortune, March 21, 2005) • “By 2010, more than half of all workers in the U.S. will be over 40. Tens of millions of baby-boomers turn 60 this year, and the decade ahead will see vast numbers of people retiring, or at least leaving their current full-time careers.” • General Electric, Dow Chemical, Northrop Grumman: capture their oldsters’ knowledge & disseminate it to younger workers before it’s too late
Lost Knowledge • “In sectors such as government, manufacturing, energy, health care, education, and aerospace, knowledge retention will become an overriding concern in the years ahead.” [David DeLong, Lost Knowledge: Confronting the Threat of an Aging Workforce, Oxford University Press, 2004]
Keynote Address: Medical Informatics and Emergency Medicine (Dr. Feied, 2004 AEM Consensus Conference on Emergency Medicine Informatics) • “Work to reduce institutional dependence on specialized personnel with ‘secret knowledge’ that allows them to complete tasks nobody else can perform. If the unit secretary is the only one who knows how to place or cancel an order, every coffee break can put a congested department further behind.”
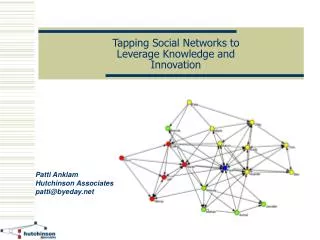
The Hidden Power of Social Networks (Cross, 2004) • Networks of informal relationships have a critical influence on work and innovation • Research shows that appropriate connectivity in well-managed networks within organizations can have a substantial impact on performance, learning, and innovation • Actors/nodes (individuals/units) and links/arcs (relationships/ties)
Conducting a Social Network Analysis • Step 1: Identify a Strategically Important Group • Integrating networks that cross core processes • Promoting innovation through connectivity in new product development or process improvement initiatives • Facilitating post-merger integration and large-scale organizational change • Supporting CoPs • Forming strategic partnerships and alliances • Improving learning and decision making in top leadership networks
Size of the Network • Typically limit to 250 people for visualization purposes (but could have more for analysis purposes) • Ask each person to rate his/her interactions with other members of the group
Step 2: Assess Meaningful and Actionable Relationships • Relationships that reveal collaboration in a network (e.g., Communication, Information, Problem solving, Innovation) • Relationships that reveal the information sharing potential of a network (e.g., access) • Relationships that reveal rigidity in a network (e.g., decision making, influence) • Relationships that reveal well-being and supportiveness in a network (e.g., liking, friendship, trust)
Survey • Confidentiality • Full disclosure of the results via an all-employee debriefing or other communication • Allow only one person or a select group to see the full results so that helpful action can be taken • Disclose no names whatsoever
Step 3: Visually Analyze the Results • UCINet-Netdraw • Pajek • Netminer • Inflow • International Network of Social Network Analysts (INSNA)
Step 4: Quantitatively Analyze the Results (Indiv. Network Measures) • In-degree centrality (the number of incoming ties a person has for a given relationship (such as communication or trust) • Out-degree centrality (the # of outgoing ties a person has for a given relationship) • Betweenness centrality (the extent to which a particular person lies “between” the various other people in the network—networks that contain individuals with high betweenness are vulnerable to having info flows disrupted by power plays or key individuals leaving)
Indiv. Network Measures (cont.) • Closeness centrality (the extent to which a person lies at short distances to many other people in the network. Persons highly central with respect to closeness tend to hear info sooner than others) • Brokerage measures • Coordinators (people who broker connections within the same group) • Gatekeepers (people who broker connections between their own group and another) • Liaisons (those who broker connections between 2 different groups)
Group Measures • Density (the # of individuals who have a given type of tie with each other, expressed as a % of the maximum possible—if each person were connected to every other person in the network, the density would be 100%) • Cohesion (the average of the shortest paths between every pair of people in the network—average cohesion score should be around 2 in groups where managers are interested in employees leveraging each other’s expertise)
Step 5: Create Meaningful Feedback Sessions • Conduct interviews with a select number of people (8-10 network members) to better understand the dynamics behind the network • Look at the network analysis to determine who to interview (central and peripheral roles) • Documentation or workshop with all network participants
Step 6: Assess Progress and Effectiveness • Follow-up (post-audit): 6-9 months after network analysis is first conducted • SNA research areas: • Improving the calculation of interval/ratio scales for measuring the strength of ties between actors (AHP) • Effective representation of complex network information (IBM’s Raison, data mining tool)
Identifying Types of Individuals in the Network • Central Connectors: most arrows pointing to them • Unsung Hero: “Invisible” work but critical to the network and can consume many hours each day (may be completely unrecognized by senior management) • The Bottleneck: some people become so central to the organization that they end up holding the group back
Boundary Spanners • Provide critical links between 2 groups of people that are defined by functional affiliation, physical location, or hierarchical level • Can play important roles in large-scale change efforts
Information Brokers • Indirect connections • For example, Ian and Frank have no direct connection, but each has a relationship with Gayle (so they are connected through her); people such as Gayle play a brokering role that can hold together entire groups
Peripheral Specialists • Have one connection each and are not linked to each other • Some people are “stuck” (e.g., newcomers) on the periphery and others may “choose” (e.g., experts) to be on the periphery
Case Study: Examination of Raw Data • All data downloaded to Excel spreadsheet • 225 respondents answered questions 1, 2, and some portion of 13, identifying other employees from whom they sought a form of knowledge advice • All others were removed, including duplicates • All cells containing names were examined identifying abbreviated names, the use of initials, variations in spelling, etc. • Numbering of all names yielded 698 employees
Examination of Raw Data • The data identified 1,621 knowledge advice connections or communications between the 698 employees • Each connection between employees was assigned a weight based on the frequency of the knowledge being sought and the importance of the knowledge • Complete employee data for respondents, non-respondent employee numbers, employee connections and connection weights were loaded into NetMiner 2.5 for social network analysis. • Analysis was conducted across 6 defined advice communication areas
Social Network Analysis Schematic Employee Adjacency – Advice Communication Matrix Advice Communications Employee Employee Attributes Communication Measures
Social Network Analysis Schematic Employee Adjacency – Advice Communication Matrix • Advice Communications • Context K – Advice • Expert Process K – Advice • General K – Advice • Process K – Advice • Strategic K – Advice • Relationship K - Advice Employee
Social Network Analysis Schematic Employee Adjacency – Advice Communication Matrix • Employee Attributes • Department • Level (Position Hierarchy) • Tenure Employee
Social Network Analysis Schematic Employee Adjacency – Advice Communication Matrix • Communication Measures • Centrality (in and out degree) • Closeness • Betweenness • Cliques • Density • Brokerage Employee
Is there much intra-departmental communication? • This can be measured by examining the amount of communication within each department in two areas: density and cohesiveness • Density is the proportion of possible lines that are actually present in the network. It is the ratio of the number of lines present to the maximum possible. • Cohesion Index is the extent to which ties are concentrated within a subgroup, rather than between subgroups.
Is there much inter-departmental communication? • Departments “blocked” and then examined for degree and density measures • As with individuals, departments yielded low density of communication with other departments • Some departments have no communication with others within certain knowledge areas (“structural holes”) • XYZ department: unconnected from all others in 4 of the 6 knowledge types, including the knowledge of “who” has the organizational information • JKL department: not connected within 3 of the knowledge types including the “what” of applications and the “how” of network and systems work
Is the organization well connected among employees? • Most communication is occurring between non-managerial employees • Of the 1,621 knowledge connections, 1,199 were connections to non-management employees • 74% of reported advice communications were employee to employee
Is the organization well connected among the employees and the managers, directors and executives? • 336 of the 1,621 knowledge connections (21%) were to persons in management positions • 36 of 62 Managers, Directors, and Executives were named as sources of knowledge advice 5 or more times • Communication rate from employee to employee is the highest
Are the junior employees interacting with the senior employees? • Junior employees have limited contact with senior employees (executives) • Employee contact is greater with other employees • Greatest direct connection between executives and non-managerial employees was in the Process K area • Lowest level: Context K
Are the directors and executives in the “Power” positions centrally located? • Executives and directors are not present or are relatively weak in most power or central positions in knowledge advice communications • A single executive was prominent in Strategic, General, and Relationship knowledge areas • Three others in managerial positions appeared in central positions, with a single one of these appearing in 4 of the 6 K types • Most power or central positions are held by non-managerial employees or a single expert