Download
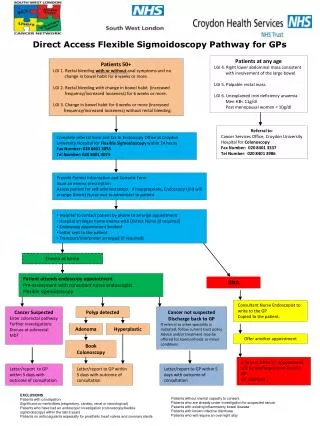
1 / 41
410 likes | 521 Views
Edinburgh Pathway Editor a flexible tool for biological model creation. Anatoly Sorokin Edinburgh Centre for System biology. System biology modelling gap.

E N D
Edinburgh Pathway Editora flexible tool for biological model creation Anatoly Sorokin Edinburgh Centre for System biology
System biology modelling gap “Biologist can be divided into two classes: experimentalists who observed things that cannot be explained, and theoreticians who explain things that cannot be observed.” Katzir-Katchalsky A. Sorokin
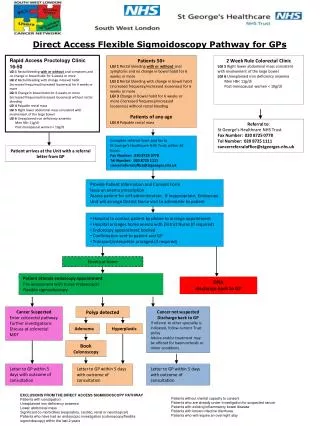
Electronic Networks T4 td deaminase SP8 T5 thyA PPi ADP dC M P Literature dut T4 dcd PBS2 H O dCTPase 2 dTMPase dCTP dUTP ADP ADP NH ppk ppk ndk 3 ndk dUDPase ATP ATP dCDP dUDP rps A T4 nrd AB pyrH T4 nrd C ATP ATP cmk CDP UDP UMP ATP ATP ndk ndk ppk ppk ATP Knowledge Integration & Databases Questions: Hypothesis testing Interesting modelling Modes of action observations: ‘ gems Modelling Intervention sites Simulation Modelling Results Validate hypotheses Hypothesis generation Find modes of action, intervention sites, bindings, targets, etc. Network Reconstruction and Modeling Pathway Databases Experimental Quantitative Data Expert Knowledge Experimental Data A. Sorokin
Electronic Networks T4 td deaminase SP8 T5 thyA PPi ADP dC M P Literature dut T4 dcd PBS2 H O dCTPase 2 dTMPase dCTP dUTP ADP ADP NH ppk ppk ndk 3 ndk dUDPase ATP ATP dCDP dUDP rps A T4 nrd AB pyrH T4 nrd C ATP ATP cmk CDP UDP UMP ATP ATP ndk ndk ppk ppk ATP Knowledge Integration & Databases Questions: Hypothesis testing Interesting modelling Modes of action observations: ‘ gems Modelling Intervention sites Simulation Modelling Results Validate hypotheses Hypothesis generation Find modes of action, intervention sites, bindings, targets, etc. Network Reconstruction and Modeling Pathway Databases Experimental Quantitative Data Expert Knowledge Experimental Data A. Sorokin
Biological model Keep expert knowledge Proved by experiment Variable level of details Variable level of certainty Numerical model Based on biological model Contains detailed description of the process Ready for simulation Contains arbitrary assumptions Two types of model A. Sorokin
Biological models A. Sorokin
Mathematical models PDN = (SN,TN,ST-Edge,TS-Edge) where SN = ( sn1 , sn2 ..., sni ), TN=( tn1 , tn2 ,..., tnj ), ST-Edge = SN ×N, TS-Edge = TN ×SN, and sni =(sn j , snk ,..., snn : cmi ). A. Sorokin
Link model types together • Experimentalist oriented • Support biological models • Support “Round trip” development Purification, reduction, assumptions, parameters Numerical model Biological model Observation, Questions, Predictions A. Sorokin
System biology modelling gap • Models are distributed in large number of papers • Models are published in informal style • Difficult to trace all details A. Sorokin
Systems Biology Markup Language (SBML) • XML-based language to share model information • Model of biological process • Simulation oriented • Expect detailed description of the process • No structure to store annotation data A. Sorokin
System Biology Graphical notation (SBGN) • Standard Graphical notation • Requirements • (1) Expressiveness: The notation system should be able to describe every possible relationship among genes and proteins, as well as biological processes. • (2) Semantically unambiguous: Notation should be unambiguous. • (3) Visually unambiguous: Each symbol should be clearly identified and cannot be mistaken with other symbols. This feature should be maintained with low-resolution displays, as well as black/white printings. • (4) Extension Capability: The notation system shall be flexible enough to add new symbols and relationship in a consistent manner. This may include the use of color-coding to enhance expressiveness and readability, but information shall not be lost even with black and white displays. A. Sorokin
Requirements • Validation of networks vs. controlled vocabularies • of Small Molecules, Genes, Proteins, and transcripts to control confusion of multiple names across research areas. • Networks should allow adding of • Literature objects (Medline etc…) • Kinetic information to reactions • Export in wide variety of formats • Any desired data related to model creation • Build in links to, and load • publicly available data sources… A. Sorokin
Edinburgh Pathway Editor A. Sorokin
Basic features • Small number of basic objects to represent main concepts of the biological network • Metadata-oriented design • Flexible visual presentation • Hierarchical data storage • Customisable direct link to external databases • Eclipse-based open plug-in design • XML-based internal presentation • Export to SBML A. Sorokin
Main objects • Shape • Port • Process • Link • Label A. Sorokin
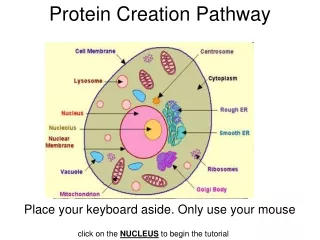
Shape • Shape represents the biological object or subsystem, treated as "a black box" . A. Sorokin
Port • The port is used to designate the state of the object, in which it could interact with other objects. The port is the interface between the objects. A. Sorokin
Process • Process visualises sequence of events, e.g. a biochemical reaction or protein interaction. • Chemical reactions, • protein binding • gene activation A. Sorokin
Link • Link is used to represent any pair-wise relation between objects including "identity" or "act on" relations. A. Sorokin
Label • Label is a visual object to represent textual information and to allow incorporate links to other maps and resources. A. Sorokin
Context • Description of metadata related to the map • User-defined object types • Domain-specific object properties • Default values A. Sorokin
Types of properies • Simple data • Text • Collections • Visual data A. Sorokin
Simple string of characters: EC: 6.4.1.2 PubMed: 7567999 Useful for ID in external database (PubMed, GenBank etc.) Abbrevitions Simple descriptions Numerical values (constants, parameters etc.) Simple data A. Sorokin
Rich text with formatting, greek letters, fonts, colours, hyperlinks etc. Useful for: Name of compounds, proteins etc. Human readable descriptions References to Internet resources Text A. Sorokin
List of data of the same type List of references (to PubMed) List of synonyms or aliases Collections (Text & Simple data) A. Sorokin
Link the map object with Internet or another map Hierarchical organisation of information Submodels References to external resources Hyperlinks A. Sorokin
Shows text when mouse move on the object Useful for Detailed human readable description of object Summarized view of object properties Hover text A. Sorokin
Open new pop-up by pressing F2 button Useful for: Extended description of object with hyperlinks etc Help text A. Sorokin
There is simple language to reference values of properties of this object or related objects Useful for Default values of Help and Hover text Default value of the Label Reference to value of the property A. Sorokin
Visual properties: colour A. Sorokin
Visual properties: image A. Sorokin
Inheritance, default value A. Sorokin
Visual representation A. Sorokin
Visual representation A. Sorokin
Visual representation A. Sorokin
Visual representation A. Sorokin
Visual representation A. Sorokin
Development team • Igor Goryanin, The University of Edinburgh • Kirill Paliy, EMP Project Inc. • Alex Selkov, EMP Project Inc. • Oleg Demin, Moscow State University www.bioinformatics.ed.ac.uk/epe/ A. Sorokin
Network Reconstruction and Modeling Pathway Databases Electronic Networks T4 td deaminase SP8 Literature T5 thyA PPi ADP dC M P dut T4 dcd PBS2 H O dCTPase 2 dTMPase dCTP dUTP ADP ADP NH ppk ppk ndk 3 ndk dUDPase ATP ATP dCDP dUDP rps A T4 nrd AB Experimental Quantitative Data pyrH T4 nrd C ATP ATP cmk CDP UDP UMP ATP ATP ndk ndk ppk ppk ATP Network Expert Knowledge Reconstruction Knowledge Experimental Data Integration & Databases Questions: Modelling Hypothesis testing Interesting modelling Simulation Modes of action observations: ‘ gems ” Intervention sites Modelling Results Validate hypotheses Planning experiments Hypothesis generation Find modes of action, intervention A. Sorokin sites, bindings, targets, etc.
Biological Model Modelling Simulation Network Reconstruction and Modeling Pathway Databases Electronic Networks T4 td deaminase SP8 Literature T5 thyA PPi ADP dC M P dut T4 dcd PBS2 H O dCTPase 2 dTMPase dCTP dUTP ADP ADP NH ppk ppk ndk 3 ndk dUDPase ATP ATP dCDP dUDP rps A T4 nrd AB Experimental Quantitative Data pyrH T4 nrd C ATP ATP cmk CDP UDP UMP ATP ATP ndk ndk ppk ppk ATP Expert Knowledge Knowledge Experimental Data Integration & Literature Databases Questions: Hypothesis testing Interesting modelling Modes of action observations: ‘ gems ” Intervention sites Modelling Results Validate hypotheses Planning experiments Hypothesis generation Find modes of action, intervention A. Sorokin sites, bindings, targets, etc.