Download
1 / 25
250 likes | 391 Views
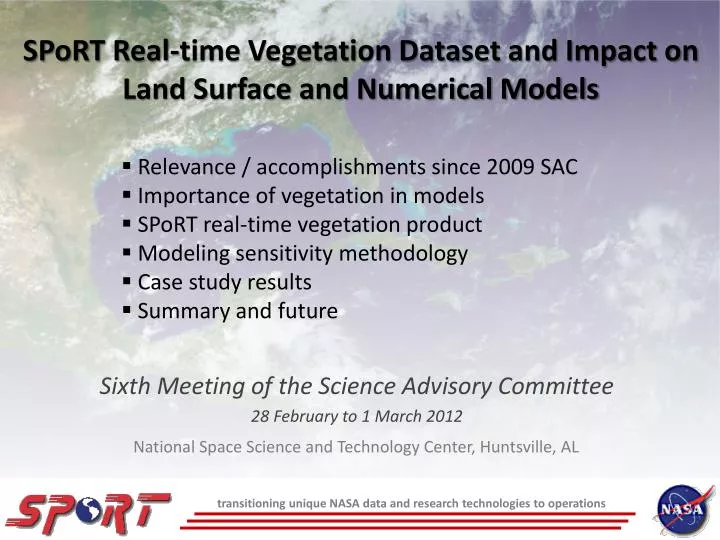
Relevance / accomplishments since 2009 SAC Importance of vegetation in models SPoRT real-time vegetation product Modeling sensitivity methodology Case study results Summary and future. SPoRT Real-time Vegetation Dataset and Impact on Land Surface and Numerical Models.

E N D
Relevance / accomplishments since 2009 SAC • Importance of vegetation in models • SPoRT real-time vegetation product • Modeling sensitivity methodology • Case study results • Summary and future SPoRT Real-time Vegetation Dataset and Impact on Land Surface and Numerical Models Sixth Meeting of the Science Advisory Committee 28 February to 1 March 2012 National Space Science and Technology Center, Huntsville, AL transitioning unique NASA data and research technologies to operations
Relevance to NASA/SPoRT • Addresses NWS forecast challenge • Improved local model forecasts needed, especially for warm-season processes • Use of NASA EOS datasets • MODIS Aqua and Terra • Data can be incorporated into both Land Information System (LIS) and Weather Research and Forecasting (WRF) models • Improve current SPoRT modeling capabilities • Expand upon data denial experiments with SPoRT partner WFOs • Supports the NASA-Unified WRF (NU-WRF) project: A larger-scale NASA project hosted by GSFC transitioning unique NASA data and research technologies to operations
Accomplishments since 2009 SAC Meeting • 2009 SAC Recommendation: “Broaden the use of this [data denial] or similar concepts to help quantify the impact of unique NASA data sets.” • Developed vegetation dataset that can be used by SPoRT partners for real-time modeling • Wrote module to incorporate vegetation data into LIS and NU-WRF • Transitioned data for use by SPoRT partners in WRF model and WRF-EMS without any required source code changes • Instructions document for WFOs to use SPoRT vegetation in WRF-EMS • Impact investigations • 2011 intern student • Publications and presentations • Annual AMS meetings (2011, 2012) • SPoRT virtual workshop (31 Aug 2011) transitioning unique NASA data and research technologies to operations
Importance of Vegetation in Models • Evapotranspiration from Healthy Vegetation • Significant contribution of moisture transport into boundary layer during warm season • Important to represent vegetation accurately in models • Horizontal and Vertical Density of Vegetation • Greenness Vegetation Fraction (GVF), horizontal density • Leaf Area Index (LAI), vertical density • In Noah Land Surface Model (LSM), LAI is prescribed while GVF varies spatially by model grid cell • Other parameters depend on vegetation (e.g. albedo) transitioning unique NASA data and research technologies to operations
SPoRT Daily Real-Time Vegetation Product • Continental-U.S. NDVI/GVF grid • NDVI from real-time MODIS swaths, mapped to CONUS grid • Inverse time-weighted NDVI composites • Query up to 6 NDVI values in previous 20 days at each pixel • Similar to original MODIS SST algorithm • Daily composites generated since 1 June 2010 • Calculate GVF on 0.01° grid for use in LIS/Noah LSM • Following Zeng et al. (2000) and Miller et al. (2006) • Based on distributions of NDVImax as a function of land use class NDVImin NDVImax,i transitioning unique NASA data and research technologies to operations
GVF 1-year Diff on 15 July: 2010 to 2011 • Big 1-yr diff in GVF • TX was very wet in early summer 2010 • Virtually no rain in TX/OK in 2011 • 1-yr reduction in GVF, up to 40%+ • Shows how much GVF can change from year to year • Climo doesn’t cut it! • 2011 MODIS GVF actually compares better to NCEP climo • Texas summers should be dry! 2010 2011
Approach and Methods • Assess impacts of real-time MODIS vegetation data on LIS/Noah and model forecasts of severe weather • Document model sensitivity to real-time versus climatological greenness vegetation fraction (GVF) • Can incorporating real-time GVF improve simulations of severe weather events? • Employ unique NASA assets in modeling study • NASA Unified-Weather Research and Forecasting (NU-WRF) • Combination of several NASA capabilities and physical parameterizations into a single modeling software package transitioning unique NASA data and research technologies to operations
Approach and Methods, cont. • Offline LIS run: • Noah Land Surface Model • Atmospheric analyses from GFS Data Assim. System transitioning unique NASA data and research technologies to operations
Results: General Observations • Substantial changes to sensible/latent heat fluxes, and 2-m temperatures/dewpoints in places • However, most WRF simulations look similar to each other • Similar model errors in onset/timing of convection • Good/poor control simulations good/poor experimental forecasts • Greatest impact occurs with maximum surface heating • 17 July 2010: “Clean” case (little pre-existing clouds/precip) with convection firing late in the day transitioning unique NASA data and research technologies to operations
17 July 2010 WRF Case Study MSP OMA DSM • Urban areas can be resolved much better by the SPoRT GVF. • Higher GVFs prevail from NE to ND.
17 Jul 2010, WRF 21-h fcst: 2-m Temp • Higher SPoRT GVFs in the western portion of the focus area correctly led to lower forecast 2-m temperatures transitioning unique NASA data and research technologies to operations
17 July 2010, WRF 21-h fcst: 2-m Dewp/CAPE • Higher GVF values generally led to higher 2-m dewpoints • Net result was increase in CAPE up to 1000 J kg-1 transitioning unique NASA data and research technologies to operations
17 July 2010, WRF Fcst 1-h precip: 27/33 h CNTL CNTL EXP EXP OBS DIFF OBS DIFF • CNTL run moves convection southward through Iowa too quickly • EXP run correctly re-develops convection along IA/NE border in region of higher residual CAPE • Both model runs close on placement with initial development and movement • Some intensity variations transitioning unique NASA data and research technologies to operations
Summary and Conclusions • Developed a CONUS GVF dataset • 1 June 2010 to date • Can be ingested into LIS, WRF, NU-WRF, and WRF-EMS • Significant GVF changes from summer 2010 to 2011 • Anomalously green over Texas in July 2010 • Year-to-year variations cannot be represented by a climatology dataset • Using SPoRT GVF showed some improvement on the 17 July 2010 severe case • Real-time vegetation datasets have potential to enhance accuracy of forecast models transitioning unique NASA data and research technologies to operations
Future Work • Short-term • Contribute results to COMET module • Additional case studies, verification statistics • Study impact of GVF differences over Texas related to 2011 drought • Improve albedo in LIS/WRF using newlook-up table method based on input GVF • Long-term • Collaborate with NCEP/EMC: NOAA Global Vegetation Index • Enhanced climo (weekly vs. monthly) • Initial development of real-time productdocumented in Jiang et al. (2010, JGR) Original seasonal Albedo Albedo: Look-up table transitioning unique NASA data and research technologies to operations
Backup Slides transitioning unique NASA data and research technologies to operations
Default GVF Dataset in WRF/LIS • Five-Year Monthly Global Climatology • Derived from AVHRR Normalized Difference Vegetation Index (NDVI) data from 19851991 • 0.144° resolution, valid at mid-point of each month • Currently in Noah LSM within NCEP/NAM and WRF models • Operational at NCEP since 1997 (Ek et al. 2003) • Cannot account for variations in GVF due to: • Weather/climate anomalies (e.g. drought, excessive rain) • Land-use changes since the early 1990s (e.g. urban sprawl) • Wildfires and prescribed burn regions transitioning unique NASA data and research technologies to operations
NASA-Unified WRF (NU-WRF) • Demonstrate NASA model capabilities at satellite-resolved scales • Based on Advanced Research WRF dynamical core • Incorporates numerous capabilities & NASA assets • Physics schemes (Goddard radiation, microphysics) • Goddard satellite data simulator unit (GSDSU) • Land Information System (LIS) and LIS Verification Toolkit • Goddard Chemistry Aerosol Radiation and Transport (GOCART) • Model verification and numerous post-processing options • Coupling between WRF model, LIS/GOCART, GSDSU transitioning unique NASA data and research technologies to operations
GVF Comparison: 17 July 2010 • Improved resolution • Ability to resolve vegetation variation in complex terrain • Greener in Western U.S. • Nearly 20-40% over High Plains • High Plains rainfall well above average in previous 3 months NW NE SE SW
GVF Quadrant Comparison: SPoRT vs. NCEP; 1 June to 31 October • SPoRT GVFs: • Consistently higher in western U.S. • Have more day-to-day variability • NE: Slightly lower in mid-summer, then higher in early Fall • SE: Closest to NCEP • Warmer than normal temperatures out East in Fall 2010 transitioning unique NASA data and research technologies to operations
Land Surface Model Stats: NW Quadrant • Higher SPoRT GVFs lead to: • Higher latent heat fluxes due to increased evapo-transpiration • Lower sensible heat flux initially • More rapid drying of soil moisture • By late Summer/Fall: • Both latent and sensible heat flux increase • This is due to drier soils that cause more rapid surface heating Sensible Heat Flux Diff: Time of Peak Heating GVF Diff (SPoRT – NCEP) Soil Moisture Diff Latent Heat Flux Diff: Time of Peak Heating transitioning unique NASA data and research technologies to operations
17 July 2010: Verification Stats Bias Error Standard Deviation transitioning unique NASA data and research technologies to operations
22 May 2011, WRF fcst 1-h precip: 23/27 h CNTL EXP CNTL EXP DIFF OBS DIFF OBS • More intense 1-h rain rates in sportgvf runjust prior to tornadic event • Both runs have too much false alarm in AR • After event, sportgvf run better handles squall line evolution into Arkansas • Reduced false alarm in central Arkansas transitioning unique NASA data and research technologies to operations
Daily GVFs: 1 June to 30 Oct 2010 transitioning unique NASA data and research technologies to operations