Download
1 / 17
170 likes | 270 Views
Evolving Oceanic and Atmospheric Boundary Layer Structure During Hurricanes Gustav and Ike: Progress. L. K. Shay, E. Uhlhorn, R. Lumpkin, P. Meyers, B. Jaimes, J. Brewster, G. Halliwell, J. Zhang MPO/RSMAS, NOAA HRD, NOAA PhOD , CIMAS

E N D
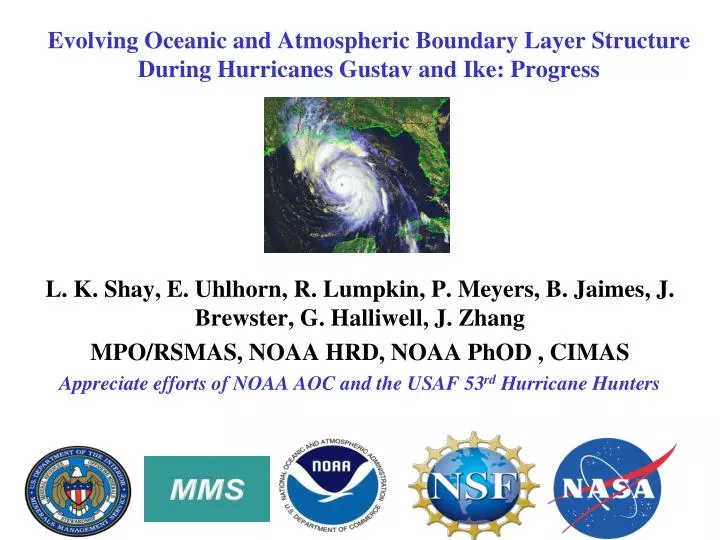
Evolving Oceanic and Atmospheric Boundary Layer Structure During Hurricanes Gustav and Ike: Progress L. K. Shay, E. Uhlhorn, R. Lumpkin, P. Meyers, B. Jaimes, J. Brewster, G. Halliwell, J. Zhang MPO/RSMAS, NOAA HRD, NOAA PhOD , CIMAS Appreciate efforts of NOAA AOC and the USAF 53rd Hurricane Hunters
Research Objectives: • Observe the thermodynamical (thermal and momentum) response in the Loop Current (LC)/Warm and Cold Core Eddies (WCE, CCE) complex from temperature and current sampling; • Determine the relative roles of shear-induced mixing and advective tendencies by the background and wind-driven flows on the upper ocean thermal response; • Quantify the momentum, energy and vorticity balances of the LC complex and its response to strong TC forcing ; and, • Examine the contribution of ocean features to surface stress and fluxes in the surface layer of the atmospheric within the direct forcing region, emphasizing the role of OML feedbacks on the atmospheric boundary layer. • Note: ONR sponsored cold wake experiments in Gilbert (88)
Why Study Gulf of Mexico Hurricane? FC Oil Industry rigs and structures sustained extensive damage in Katrina and Rita (05) and Gustav and Ike (08).
Surface Geostrophic Velocities (arrows) and SSH (color) Before Gustav (left) and Ike (right)-GFO/Jason/Envisat (http://isotherm.rsmas.miami.edu/heat)
Track and Intensity of TC’s Gustav and Ike Versus AXBTs relative to OHC and 26oC Isotherm Depth. Gustav : 191 AXBTs 111 GPS Drifters Floats Ike : 216 AXBTs 111 GPS Drifters Floats SMFR, SRA measurements.
Pre-Storm Post-Storm Change in SST Data courtesy of Dr. Chelle Gentemann
OHC Approach: Empirical Approach(Atlantic, East Pacific-West Pac Next) • Reduced gravity (g’), H20, h (ocean mixed layer depth) GDEM V2.1 • Blend and objectively map SHA from Jason-1, GFO, and Envisat (9.9, 17 and 35-d repeat track). • Infer H20 using mapped SHA and seasonal climatology. • Estimate H26 relative to H20 (via ratio). • Estimate OHC relative to 26oC using H26, h, and SST.
Pre (left) and Post (right) and Post-Pre (bottom) Ike OHC (color) and 26C isotherm depth (contour) relative to the track and intensity Ike from AXBTs. Notice the marked cooling in the Gulf Common Water north and west of the LC.
From Jaimes and Shay (MWR, 2009a) 6 kJ cm-2 22 m 114 kJ cm-2 mixed layer depth 68 m 81 m 122 m 26oC 246 m Reduced negative feedback in warm core eddies 20oC Hurricanes reach intensities closer to maximum potential intensity. Warm Eddy Cold Eddy
Gustav Drifters OHC (top panel) and Thermal Structure (lower panel)
NOAA WP-3D profiling over MMS Moorings (In collaboration with AOML HRD, AOC, TPC, NCEP) Deliverables include: V, T, S profiles to 1000 m @ 2-m resolution. Surface winds (SFMR, GPS) provided by HRD. Atmospheric profiles of V, T and RH @ 5-m resolution. • Goal: To observe and improve our understanding of the LC response to the near-surface wind structure during TC passages. Specific objectives are: • Determine the oceanic response of the LC to TC forcing; and, • Influence of the LC response on the atmospheric boundary layer and intensity.
Summary: Quality ocean data needed for coupled models! Approach serves as the prototype for coupled ocean/atmosphere measurements. Combine adaptive aircraft surveys with moored, drifter and ship based measurements as part of the MMS Dynamics of the Loop Current Study with the NOAA HFIP (AOML, NCEP), NSF and NASA (leveraging assets this year). Negative feedback (cooling/mixing induced by strong winds and CCR) as opposed to positive feedback over the LC/ WCR. Need to update OHC climatology in Atlantic basin. SST modulated by warm and cold ocean features that have to be properly initialized in ocean models and mixing processes-impact fluxes (more on this in Ivan Talk). Both temperature and current measurements needed to assess mixing schemes, fluxes and evaluate initialization schemes. Expendables (AXCP, AXCTD), drifters and floats required for satellite and oceanic and coupled model evaluations.