Download
1 / 50
500 likes | 618 Views
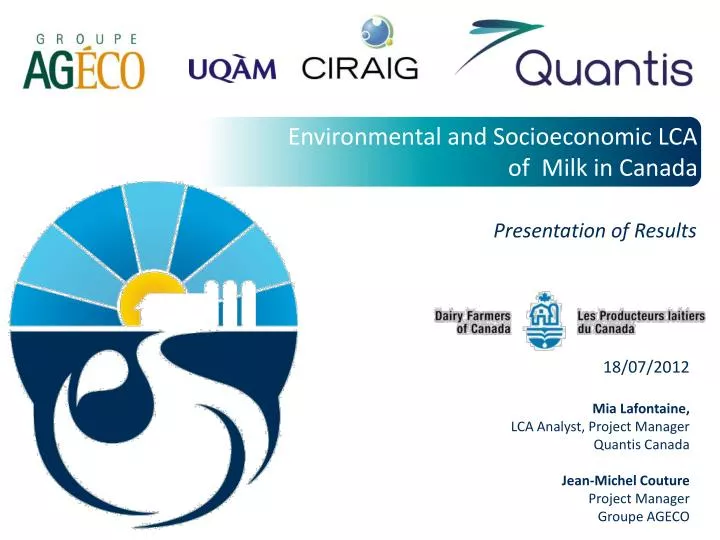
Environmental and Socioeconomic LCA of Milk in Canada. Presentation of Results. 18/07/2012 Mia Lafontaine, LCA Analyst, Project Manager Quantis Canada Jean-Michel Couture Project Manager Groupe AGECO. Table of contents. Context Environmental LCA Results Socioeconomic LCA Results

E N D
Environmental and Socioeconomic LCA of Milk in Canada Presentation of Results 18/07/2012 Mia Lafontaine, LCA Analyst, Project Manager Quantis Canada Jean-Michel Couture Project Manager Groupe AGECO
Table of contents • Context • Environmental LCA Results • Socioeconomic LCA Results • Conclusions • Insights • A roadmap • What’s Next
Context • International efforts to account and reduce GHG emissions • Consumer and media pressure towards environmental impact reduction • Additional pressure on livestock • Dairy Research Cluster 1: over 100 collaborators in 46 projects over three years • The Life Cycle Assessment (LCA) of Canadian milk - a first study to evaluate: • Environmental impacts beyond carbon • Socioeconomic aspects • Regionalized impact assessment Context| Environmental LCA | Socioeconomic LCA | Conclusions
Objectives Context| Environmental LCA | Socioeconomic LCA | Conclusions
Life Cycle Assessment (ISO 14040-44) Cradle - to -Processing Plant Gate Milk Production Context| Environmental LCA | Socioeconomic LCA | Conclusions
Regionalization 10 provinces Production of 13 331 dairy farms Environment Canada, Meteorological Service of Canada, Statistics Canada, Environment Accounts and Statistics Division, CanSIS, Ecological Stratification Working Group • Accounts for regulatory and geographical variability across Canada
Regionalization 15 ecozones and 293 ecoregions 11 soil order groups 5 watersheds and 172 sub-sheds Environment Canada, Meteorological Service of Canada, Statistics Canada, Environment Accounts and Statistics Division, CanSIS, Ecological Stratification Working Group • Accounts for spatial variability across Canada : soils, climate, regions, etc.
Canadian Milk Environmental Footprint • 1 kg: 6 km driven with a car • All Dairy: Less than 2% of Canada’s carbon footprint 1.01 kg CO2e 1 kg of fat and protein corrected milk (FPCM) • 1 kg of milk: 0.5 kg of wheat (1-2 breads) • All Dairy: 2% of Canada’s agricultural land • 1 kg: a 6 minute shower • All Dairy: Less than 1 % of Canada’s water consumption LANDUSE 1.7 m2 61 L • Context| Environmental LCA | Socioeconomic LCA | Conclusions
Impact on Water Withdrawal 61 L consumed 318 L used 190 L consumed 41 L used 12 L consumed • Irrigation, where applicable, is the main use of water • Variable by province and crops • Energy production also consumes water • Context| Environmental LCA | Socioeconomic LCA | Conclusions
Benchmarking – Water Footprint • Context| Environmental LCA | Socioeconomic LCA | Conclusions
Impact on Ecosystem Quality 1.7 m2 LAND USE Main sources of potential impact are in Feed Production: • Phosphorus fertilisation • Leaching from ground to water: eutrophication • Land use • Potential impact on biodiversity • Mineral supplements • Aquatic toxicity from leaching of spread manure • Context| Environmental LCA | Socioeconomic LCA | Conclusions
Impact on Ecosystem Quality max Ecosystem quality Average Milk median min • Important variability across Canadian provinces linked to geographical location • Milk is mostly produced in “eco-sensitive” regions • Context| Environmental LCA | Socioeconomic LCA | Conclusions
Impact on Human Health Average Milk Human health Main sources of impact are: • Ammonia emissions: • N fertilisers, housing, manure • Energy consumption: • Onsite and for electricity: NOx, SOx, Hydrocarbons • Potential toxicity through bioaccumulation, from mineral supplements in feed (and manure spreading) • Context| Environmental LCA | Socioeconomic LCA | Conclusions
Impact on Climate Change 1.01 kg CO2e Digestibility Type of storage Most variable kg CO2 equivalent (x 1) (x298) (x25) • Context| Environmental LCA | Socioeconomic LCA | Conclusions
Impact on Climate Change Climate change (kg CO2-eq/kg milk) AverageCanada • Sources of variability: • N2O emissions from fertilisers and manure are lower in Western provinces • Manure and fertilizer spreading concentrations and techniques • Feed ratios • Manure Storage • Grid mix for electricity • Context| Environmental LCA | Socioeconomic LCA | Conclusions
Benchmarking – Climate Change • Context| Environmental LCA | Socioeconomic LCA | Conclusions
Main Contributors to Impact Manure management Feed production T Livestock management Energy and buildings T Milk processing 1 kg of fat and protein corrected milk Systemboundaries Emissions & Waste management Water Withdrawal Climate Change Ecosystem Quality Human health Natural Resources
Low Footprint Management Practices • Less fertilization (choice of crops), or less impacting fertilizers (choice of fertilizers) • Use of by-products in rations (fraction of the impact) • Increased digestibility (concentrates and fresh forage) • Lower replacement ratio • Use of a covered manure structure • Context| Environmental LCA | Socioeconomic LCA | Conclusions
What if… ? • Replacement ratio (Culling) • From 2 lactation cycles to 3 + • Fertilization • Choice of synthetic fertilizer • Feed production & Diet • Fat supplements • Manure Management • Liquid to Solid • Liquid lagoon to Liquid with crust • Context| Environmental LCA | Socioeconomic LCA | Conclusions
Sensitivity Analysis: Rate of Remplacement Replacement ratio 38% Replacement ratio 33% Replacement ratio 25% - 2.5% - 6.5% • Replacement ratio • Average practice: after two to three lactation cycles (ratio 38%) • Tested practice: after three or four lactation cycles • Reduces replacement cows and their feed, manure, enteric fermentation • Context| Environmental LCA | Socioeconomic LCA | Conclusions
Scenario Analysis: Choice of Fertilisers - 11% - 7% - 17% - 37% • If all fertilisation was achieved with a single fertiliser (for demonstration) • Injected anhydrous ammonia performs better in all categories • Urea, easier to spread, has less impact than ammonium nitrate in CO2, but emits more ammonia after spreading • Limiting factors: spreading equipment availability, mixing, cost • Context| Environmental LCA | Socioeconomic LCA | Conclusions
Scenario Analysis: Enteric Fermentation - 4 % - 8 % - 13% Fat content of diet emissions CH4 Limiting factors: - Quantity of fat (lipid) that can be fed to cattle - Cost of adding more high concentrate feed in the diet • Context| Environmental LCA | Socioeconomic LCA | Conclusions
Scenario Analysis: Manure Management - 9% + 8% Impact of liquid management ˃Impact of solid management Limiting factors: - Cost of changing the storage structure and spreading mechanism • Context| Environmental LCA | Socioeconomic LCA | Conclusions
Scenario Analysis: Manure Management (Liquid) - 4% + 16% Impact of uncovered anaerobic lagoon˃Impact of natural crust cover Limiting factor: - Cost of changing the storage structure or adding a cover • Context| Environmental LCA | Socioeconomic LCA | Conclusions
The economic contribution is well-known More than 50,000 direct jobs... … and over 127,000 jobs overall • 5.5 B$ in farm receipts • 225 M$ in direct tax revenue… • … and nearly 1.4 B$ in overall tax revenue Context| Environmental LCA | Socioeconomic LCA | Conclusions
What about the socioeconomic performance? What is the dairy sector’s socioeconomic performance towards them? This is what SLCA assesses This is what this project is all about Context| Environmental LCA | Socioeconomic LCA | Conclusions • You are also – individually and collectively – corporate citizens • Your behaviours affect your surrounding – and distant – stakeholders
The SLCA perspective • A brand new assessment tool (2009) Workers Local communities Consumers Suppliers & partners Society Context| Environmental LCA | Socioeconomic LCA | Conclusions • Assesses behaviours – not processes • By identifying the organizations involved all along a product’s life cycle • By referring to a list of issues of concern • Related to five mainstakeholder categories
Specific objectives A cutting edge assessment methodology – the first of its kind A brand new perspective focusing on the dairy sector’s level of social engagement Context| Environmental LCA | Socioeconomic LCA | Conclusions • To identify the relevant specific groups of stakeholders • To develop a set of specific socioeconomic indicators • To assess the socioeconomic performance of the Canadian dairy sector • To interpret the results and to provide recommendations
Two assessment frameworks Potential HotSpots Analysis Specific Analysis Context| Environmental LCA | Socioeconomic LCA | Conclusions
Two frameworks – Two deliverables First deliverable An assessment of the degree of social engagement of the Canadian dairy farms toward their stakeholders Context| Environmental LCA | Socioeconomic LCA | Conclusions • Framework #1 • Focus on the dairy farms and their Boards • Assess their socioeconomic performance • Use of site-specific data
Four-level evaluation scale A leading socially responsible behaviour(best practices) An in-between socially responsible behaviour Use of Benchmarks A normal and minimally expected behaviour A behaviour that may have negative consequences Context| Environmental LCA | Socioeconomic LCA | Conclusions
An example A transparent and evolving assessment method Context| Environmental LCA | Socioeconomic LCA | Conclusions
Value ChainActors Farm Workers The results Society Local Communities
Value ChainActors Farm Workers The results Society Local Communities
CANADA Value ChainActors Farm Workers The results Society Local Communities
Beyond the average performance 13% of farmers are not yet involved in their community • A compliant behaviour? • Many can be already proactive or committed 22% of farmers have practices minimizing the spread of odours There is always room for improvement • A committed behaviour? • Some may not have adopted that practice – yet • Context| Environmental LCA | Socioeconomic LCA | Conclusions
Results at the Board level Value ChainActors Society Local Communities Contexte | ACV environnementale | ACV socioéconomique| Conclusions
Highlights • But there is room for further improvements • At the farm level • Going beyond the salary issue? • More practices to minimize odours? • More socially responsible procurement criteria? • At the Board level • More engagements - formal? • More diversified partnerships? • More support and supervision in regards to animal welfare? Context| Environmental LCA | Socioeconomic LCA | Conclusions • Canadian dairy sector is socially committed towards stakeholders • Producers have socially responsible environmental practices, are involved in their community and provide working conditions that go beyond labour standards • Dairy boards invest in their community and society
Two frameworks – Two deliverables Second deliverable A preliminary overview of the social risksfound among the sector’s supply chains Context| Environmental LCA | Socioeconomic LCA | Conclusions • Framework #2 • Identify the possibility of encountering risky behaviours among your upstream suppliers • Those providing fertilizers, pesticides, etc. • Use of generic data
Main findings Is it your responsibility? From a social responsibility/LCA perspective – Yes From a business/market perspective – Yes Context| Environmental LCA | Socioeconomic LCA | Conclusions • Most supply chains show low social risk • But there are some socially troubling practices occurring upstream in your supply chains – beyond your first-tier suppliers • Corruption, unsafe working conditions, non-respect of indigenous rights, unfair competition, etc.
Walmart’s supplier sustainability survey Your are part of the supply chain Context| Environmental LCA | Socioeconomic LCA | Conclusions • Five (5) questions out of 15 concern “People & Community” • Do you know the location of 100% of your suppliers? • Do you evaluate the quality of production of your business partners? • Do you have a process for managing social compliance? • Do you work with your supply base to resolve social compliance issues? • Do you invest in community development activities?
Insights • Overall good performance – environmental and socioeconomic • Important commitment to environmental practices • Mostly, low risk supply chain • Possibility of better tracking of fertilisation practices at the farm, improved manure storage • Provide guidelines on feed based on impact • Promote socially responsible behaviour to improve average socioeconomic performance among farmers, organisations, and eventually, suppliers LCA helps clarify the big picture and understand how to improve the global performance Context| Environmental LCA | Socioeconomic LCA | Conclusions
A roadmap for an ongoing commitment • A comprehensive assessment tool • To assess your current and future practices • To enhance your individual and collective socioeconomic and environmental performance • To communicate it to your customers and partners • An evolving benchmark • A committed behaviour today will lead to a compliant one tomorrow • A risk management approach • Identify your social and environmental hotspots • Anticipate social and market expectations Context| Environmental LCA | Socioeconomic LCA | Conclusion
What’sNext • Communicating results • Comparing the environmental performance of milk with nutritional alternatives • Dairy Research Cluster 2: • Farm specific calculation tool to help guide decisions • Integrating the results of Dairy Research Cluster 1 • Developing advanced modeling to allow and understand agricultural alternatives, based on geographical context and tradeoffs • Evaluating the costs of Ecological Goods and Services Context| Environmental LCA | Socioeconomic LCA | Conclusions
Thanks to the sponsors and collaborators! www.quantis-intl.com www.groupegageco.ca