Download
1 / 48
500 likes | 558 Views
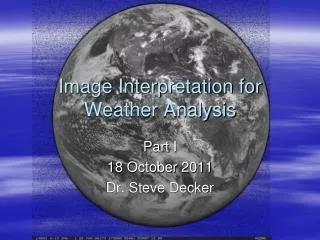
Explore the use of "Channel 3" imagery situated between VIS and IR wavelengths for better fog and low cloud identification at night compared to IR. Learn about AVHRR/3 Channel Characteristics and Experimental Fog Depth estimation. Distinguish between fog and stratus clouds using key features and RGB composites. Discover techniques for monitoring fog during day and night including recommended RGBs for different channels. Understand the challenges of fog detection at dawn/dusk and find ways to differentiate fog from other atmospheric pollutants such as dust and haze.

E N D
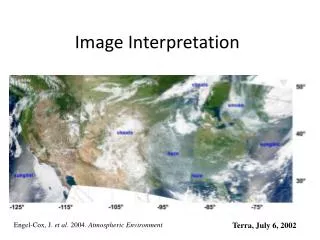
Spectral Distribution at the Top of the Atmosphere for Solar Irradiance and Earth’s Emission 104 1000 Sun 100 Earth 10 1 0.1 1 10 0.5 Radiant exitance (W m-2 µm-1) Wavelength (µm) Taking T = 5777K for Sun, max = 0.50 m and T=300K for Earth, max = 9.66 m
“Channel 3” imagery 104 1000 Sun 100 Earth 10 1 0.1 1 10 0.5 • This channel is situated in the small overlap region between VIS & IR wavelengths (3.7μm) • During night the radiation in this channel originates from terrestrial source as in IR. During day, there is a mixture of solar & terrestrial radiation with predominant role of the solar component. • Identification of fog/low cloud during night is done better than IR imagery 3.7µm Radiant exitance (W m-2 µm-1) Wavelength (µm)
Detection of Fog and Low stratus Clouds at Night • Image data from two GOES or NOAA AVHRR InfraRed (IR) channels are combined to create a product for the detection of fog and low stratus clouds at night • The "Fog Image" is obtained by a subtraction of the long wave IR window channel (10.7 micron) temperatures from shortwave IR window channel (3.9 micron wavelength) temperatures
Experimental Fog Depth • The experimental fog depth displayed in the color enhanced image is an estimate of the cloud layer thickness based on the IR brightness difference between GOES channel 2 (3.9 micron) and channel 4 (10.7 micron) • It is valid for single cloud layers only, preferably for radiation or advection fog, prior to sunrise • The color enhancement is based on a linear regression of cloud thickness determined from aircraft pilot reports and surface reports versus GOES dual channel brightness differences within about 50 miles of the aircraft reports. The dependent data set was collected using GOES-7 data.
Distinguishing Between Fog and Stratus • Fog and stratus can both be extensive and at times can be difficult to distinguish. Here are some features to look for: • Because fog often follows the terrain, fog edges are typically more irregular • Use time lapse imagery to see if the cloud is moving. Except for upslope and advective fogs, if the cloud is moving it is probably a stratus. • Check surface observations.
Non-detection of fog over snow surfaces MSG-1, 24 Feb 2004, 11:00 UTC, VIS0.8 … close-up viewover the Alps SEVIRI VIS 0.6 and VIS 0.8 channels
Non-detection of Fog over Snow Surfaces with SEVIRI HRV channel MSG-1, 24 Feb 2004, 11:00 UTC, HRV … Close-up viewover the Alps
Detection of fog over snow surfaces with SEVIRI NIR 1.6 Channel 2 1= low-level fog or stratus 2= snow 3= thin mid-level cloud with water droplets (supercooled cloud) 4= Lakes 2 1 1 2 3 4 MSG-1 24 Feb 2003 11:00 UTC Channel 03 (NIR1.6)
Recommended RGBs for Monitoring of Day-time Fog 1 1 2 2 1 2 1 1 3 MSG-1 24 Feb 2003 11:00 UTC RGB Composite R = NIR1.6 G = VIS0.8 B = VIS0.6 1= low-level fog or stratus 2= snow 3= thin mid-level cloud with water droplets (supercooled cloud)
Recommended RGBs for Monitoring of Day-time Fog 1 1 2 2 1 2 1 1 3 MSG-1 24 Feb 2003 11:00 UTC RGB Composite R = VIS0.8 G = NIR1.6 B = IR3.9r 1= low-level fog or stratus 2= snow 3= thin mid-level cloud with water droplets (supercooled cloud)
Detection of fog difficult at dawn/dusk ! Detection of fog at night (and day) with IR3.9 - IR10.8 brightness temp. diff. 2 1= low-level fog or stratus 2= clear ground 3= high-level clouds 1 3 MSG-1 14 July 2003 05:00 UTC Difference Image IR3.9 - IR10.8
Detection of Fog/Low Stratus during Daytime • VIS 0.6 and HRVIS : to discriminate between fog and ground (fog white, ground dark) • VIS 0.8: less useful because of less contrast to vegetated areas • NIR1.6 and IR3.9: to discriminate between fog and snow (fog high reflectivity, snow low reflectivity) • IR3.9 - IR10.8: fog large positive values; clear ground around 0 K (-5 K to +5 K)
Detection of Fog/Low Stratus atDawn/Dusk • IR3.9-IR10.8: fog detection difficult because of compensating effects (fog colder in IR3.9 than in IR10.8 because of lower emissivity, but reflection of solar radiation) • IR8.7-IR10.8: fog -4 K, clear ground around -1/-2 K(only small difference between fog and clear ground, but works also at dawn/dusk)
Atmospheric Pollutants : Dust and Haze Vis • This is an image from radiation observed at the blue end of the visible wavelengths (channel 1). • Haze particles scatter this very short wave radiation quite effectively, so areas of haze show up better in images from the blue end of the spectrum than from the red end. • Detected in IR if the dust layer must be deep enough to have lower temperature • The dust particles must be > 15µm to obscure radiation from earth
Dust Haze over Persian Gulf Dust seen over water
Dust Haze over Persian Gulf Dust not seen over water
Duststorm over Iraq Source Region
Dust at Night Is there any Dust over Kuwait ? An USA heptr crashed due to poor vis Night due less contrast difficult to identify the dust Contrast strech can reveal the subtle temp variations
Dust at Night Contrast stretch can reveal the subtle temp variations Need to play around with grey shades Automation would help in this type of situation
Looping of images help identification Here the dust moves towards west
Dust and Cloud (Liquid and Ice) • Dust • Appear Smooth and almost Transparent • Originate over Desert regions • Clouds • Apperar broken or cellullar • Originarte over non-desrt regions