Download
1 / 52
520 likes | 525 Views
Predicting Elections. adapted and updated from a feature on ABC News’ Nightline. In 2012 Barack Obama and Mitt Romney ran for President. All the TV networks and both campaigns knew by 3pm Central Time that Obama had won the election.

E N D
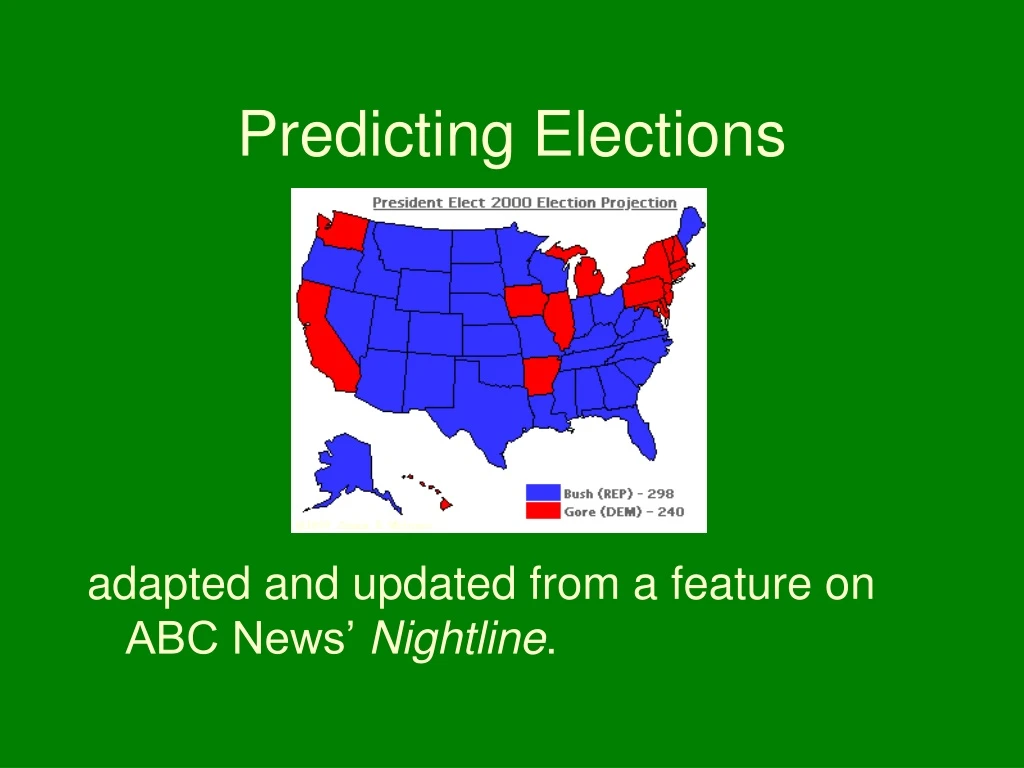
Predicting Elections adapted and updated from a feature on ABC News’ Nightline.
All the TV networks and both campaigns knew by 3pm Central Time that Obama had won the election.
In 2008 Barack Obama and Bill Clinton and John McCain ran for President.
All the TV networks and both campaigns knew by 11:00am Central Time that Obama had won the election.
In 2004 George W. Bush ran against John Kerry for President.
All the TV networks and both campaigns knew by 4:00pm Central Time that Bush had won the election.
All the TV networks and both campaigns knew by noon Central Time that Clinton had won the election.
In every election, the networks wait to broadcast this information until 8pm Central Time, when polls in the majority of states have closed.
From 1964 through 2012 there was only one election (2000) when the networks didn’t know the outcome before the time the evening news was broadcast.
Even in 2016, the election exit polls showed that Trump would win the electoral vote, but Clinton would win the popular vote.
The networks knew this by about 4pm, though many reporters didn’t believe the results.
Why is it that TV networks are almost always right when they predict elections?
They are careful to take a large, good sample In most election years, the networks pool their resources to take a stratified random sample of as many as 10,000 voters.
After the problems in 2000, they have surveyed 40 – 50,000 people each election.
They repeatedly poll each state before the election, looking for consistency in the results. They use the results to pre-sort states by how they expect them to vote (red vs. blue).
Pre-sorting lets them put most resources into “toss-up” states (like Iowa) that could go either way.
They compute an estimate of each candidate’s percentage of the vote, including a margin of error, and only call states where the victory margin victory exceeds the margin of error.
EXAMPLE Poll says the Republican will win South Dakota with 58% + 3% The Republican will probably get somewhere between 55% and 61% Call South Dakota for the Republican.
EXAMPLE Poll says Democrat will win Nevada with 51% + 3% The Democrat could get anywhere between 48% and 54% Nevada is too close to call.
The mathematics of statistics gives them confidence that their results will be correct between 95 and 99% of the time.
The polls from all news agencies showed that the Florida race (and the nationwide electoral vote) was too close to call—which was, in fact true.
Most polls said Al Gore had won Florida, but by a smaller margin of victory than the margin of error for the poll.
ABC and CBS said later they felt pressure from advertisers to make a decision, so they called Florida for Gore around 9pm.
Fox News called Florida for Bush around midnight. (Later analysis showed Fox’s poll was also too close to call.)
After the Fox call, ABC and CBS took back their call for Gore and declared Florida too close to call.
Later reviews of the polls showed the ABC/CBS poll (which was also used by NBC and CNN) had a higher percentage of minorities than had actually voted in Florida.
The Fox poll had a disproportionately high percentage of voters in the northern part of the state, which went heavily for Bush.
Several independent investigations in 2001 and 2002 had mixed results.
Using a variety of re-count procedures, four investigations showed Gore would have won Florida, while three showed Bush would have won the state.
However the Supreme Court stopped the re-count, and Gore conceded the election long before these investigations happened.
… So, basically the networks were right. They just too quick on the draw.… It really was too close to call.
During the 2016 election, an exit poll in New Jersey asked 312 people who they voted for in the Presidential election. 178 said they voted for Clinton 128 said they voted for Trump 6 said they voted for other candidates.
Estimate the percentage of the vote Clinton got in New Jersey, with 95% confidence.
Since 178 out of 312 people surveyed said they voted for Clinton, we know that about 57% of the sample said they voted for her. This is called a point estimate and is the number they’d report on the news.
To find the confidence interval, go to STAT TESTS on your calculator.
It asks for the number with a characteristic, the total number, and the confidence level.
When you press CALCULATE, it gives you the interval estimate.Here the actualpercentage of Clinton votersis between about51½% and 62½%.
In fact, the actual percentage of New Jersey voters who voted for Clinton was about 58%, which is well within this range.
Now consider this …An exit poll in Alabama in 2016 surveyed 212 voters. 73 said they voted for Clinton 132 said they voted for Trump 7 said they voted for other candidates.Find a 90% confidence interval for the percentage that voted for Trump.
In fact, the actual percentage of Alabama voters who voted for Clinton was about 63%, which is well within this range.
Now consider this …An exit poll in Pennsylvania in 2016 surveyed 611 voters. 297 said they voted for Clinton 292 said they voted for Trump 22 said they voted for other candidates.Find a 99% confidence interval for the percentage that voted for Clinton.