Download
1 / 32
320 likes | 327 Views
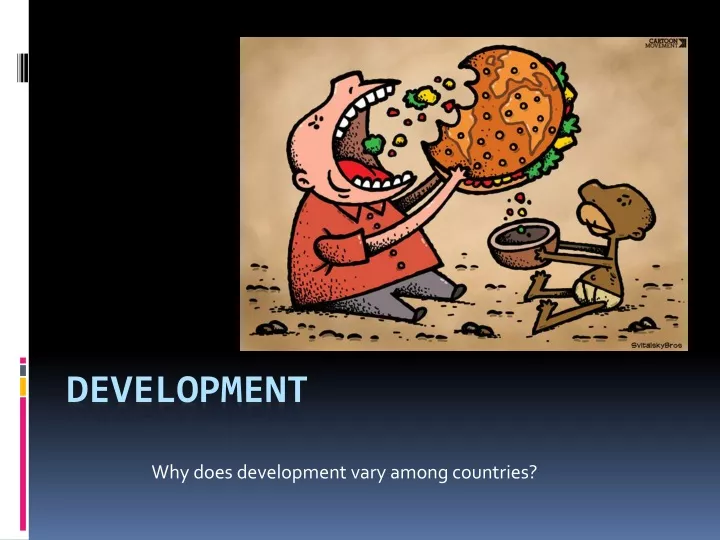
Why does development vary among countries?. Development. What is Development?. Implies progress (materialism?) Improvements in technology, production, & socioeconomic welfare

E N D
Why does development vary among countries? Development
What is Development? • Implies progress (materialism?) • Improvements in technology, production, & socioeconomic welfare • Modern notion of development related to the Industrial Revolution & the idea that technology can improve the standard of living • Wealth does not depend solely on what is produced, it depends on how and where it is produced • Examples?
Indicators of Development • Economic • Gross domestic product (GDP) per capita • Types of jobs • Raw materials • Consumer goods • Social • Education & literacy • Health & welfare • Demographic • Life expectancy • Infant mortality rate • Natural increase rate (NIR) • Crude birth rate
Telephones per Population Fig. 9-4: Mean telephone lines per 1,000 persons, 2002. MDCs have several dozen phone lines per 1,000 persons, while the poorer developing countries may have less than 10.
Student-Teacher Ratios Fig. 9-5: Students per teacher, primary school level. Primary school teachers have much larger class sizes in LDCs than in MDCs, partly because of the large numbers of young people in the population (Fig. 2-15).
Persons per Physician Fig. 9-6: There is a physician for every 500 or fewer people in most MDCs, while thousands of people share a doctor on average in LDCs.
Calories per Capita Fig. 9-7: Daily available calories per capita as percent of requirements. In MDCs, the average person consumes one-third or more over the required average minimum, while in LDCs, the average person gets only the minimum requirement or less.
Looking through all the maps that measure development, we gain a sense that many countries come out in approximately the same position no matter which of these measures is used
Human Development Index (HDI) • Created by the UN, recognizes that a country’s development is a function of all three of the factors; economic, social, & demographic • Calculated since 1990 • Highest possible is 1.0 • Country with the highest? Lowest? • Norway (0.944) • Niger(0.348)
Put the following in order from highest HDI to lowest: • Afghanistan • Japan • Haiti • Sierra Leone • Chile • Canada • USA • Turkey • Rwanda • Australia • South Africa • China • Australia • USA • Canada • Japan • Chile • Turkey • China • South Africa • Haiti • Rwanda • Afghanistan • Sierra Leone
Human Development Index Fig. 9-1: Developed by the United Nations, the HDI combines several measures of development: life expectancy at birth, adjusted GDP per capita, and knowledge (schooling and literacy).
Chapter 9 Development 2014 update
GDP/GNP • Gross Domestic Product/ Gross National Product • Total value of goods/services produced in a country during a year, divided by total population • Per capita GDP +$20,000 in MDC’s, $1000 in LDC’s • Average hourly wage in MDC’s vs. LDC’s • Per capita GDP measures average wealth, not distribution • Gap widening between MDC’s & LDC’s
Limitations of GDP • Includes transactions in the formal economy – govt’s monitor & tax • Several countries have GDP’s less than $1000/year, a figure so low that seems impossible that people could survive on it • Survival of these countries is the informal economy – illegal or uncounted economy (garden plot in the yard, black market, drug trade)
Limitions Cont’d… • GDP masks the extremes in the distribution of wealth within a country • Middle Eastern oil countries (Kuwait & UAE), have per capita GDP’s over $15,000 (higher than several European states) • UAE made up of 7 emirates, Abu Dhabi, the emirate that dominates the petroleum industry, generated 58% of country’s GDP in 2002. • Dubai, generated 27% of GDP & the Qaywayn emirate generated 0.6% of the country’s GDP
Annual GDP per Capita Fig. 9-2: Annual gross domestic product (GDP) per capita averages over $20,000 in most developed countries but under $5,000 in most less developed countries.
Types of Jobs • Primary – Agriculture, mining, fishing • Secondary – manufacturing • Tertiary – Services • Quaternary/Quinary ? • Distribution of workers varies widely between MDC’s & LDC’s • Ex. Agriculture (75% vs 5%) - why?
For each of the jobs below, are they: Primary, Secondary, or Tertiary economic activities. • Farmer • Butcher • Lumberjack • High School Teacher P=Primary • Fisherman • Doctor • Rancher S=Secondary • Kawasaki assemblyplant worker • Carpenter T=Tertiary • Computer programmer • Miner • Lawyer • Jeweler • Stock Market Analyst • Fireman
Farmer P • Butcher S • Lumberjack P • High School Teacher T • Fisherman P • Doctor T • Rancher P • Kawasaki assemblyplant worker S • Carpenter S • Computer programmer T • Miner P • Lawyer T • Jeweler S • Stock Market Analyst T • Fireman T
Employment Changes by Sector Fig. 9-3: Percentage employment in the primary, secondary, and tertiary sectors of MDCs has changed dramatically, but change has been slower in LDCs.
Raw Materials • Development = access to raw materials • Minerals, trees, etc. • Energy • Water, coal, oil natural gas, etc. • Import from colonies once supplies ran low • Some countries have thrived despite a lack of raw materials (Japan, Switzerland)
Education/Literacy • Quantity of education • Average Years of schooling • Global: 7 years • Developing: 6 years • Developed: 11 years • Quality of education = student/teacher ratio & literacy rate • MDCs publish many more books b/c their citizens can read • Students in LDCs usually learn from books that are not in their native language • Literacy rate = % of pop. that can read & write
Health & Welfare • # of people/doctor or hospital etc. • Diet as important indicator of health • # of calories/ person • Public assistance programs • ex. Ontario Welfare System, Toronto Public Housing
Demographic Indicators • Life Expectancy • Gap is greater for females than males • Average life expectancies of a baby • Global average: 70 years • Developed country: 80 years • Developing country: 68 years • Infant Mortality Rate • 90:10 vs. 99:1 • Natural Increase Rate • 2%+ in LDCs, 1%- in MDCs • Crude Birth Rate