Download
1 / 17
230 likes | 676 Views
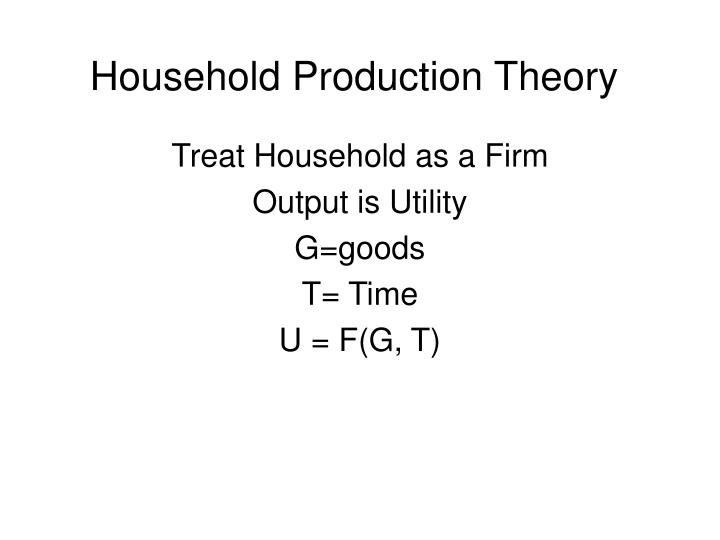
Household Production Theory. Treat Household as a Firm Output is Utility G=goods T= Time U = F(G, T). Household Production Theory. Goods. Isoquant; Slope = -(MU t /MU G). G 0. Budget constraint; Slope = -(W/P). U. t 0. Home Time.

E N D
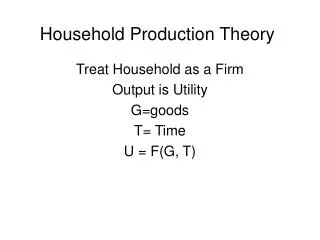
Household Production Theory Treat Household as a Firm Output is Utility G=goods T= Time U = F(G, T)
Household Production Theory Goods Isoquant; Slope = -(MUt /MUG) G0 Budget constraint; Slope = -(W/P) U t0 Home Time
Wages and Goods Intensive vs Time Intensive Home Production How do we cook?
Huffman, 2006. “The Story Behind the Post-War Decline in Women’s Housework: Prices, Income, Family Size and Technology Effects in a Demand System
Huffman, 2006. “The Story Behind the Post-War Decline in Women’s Housework: Prices, Income, Family Size and Technology Effects in a Demand System
Daily time allocation to meal preparation, by gender and income Lisa Mancino and Constance Newman Who Has Time To Cook? How Family Resources Influence Food Preparation May 2007. USDA ERRN 40. http://www.ers.usda.gov/publications/ERR40/err40.pdf
Daily time allocation to meal preparation for women, by income and market work intensity Lisa Mancino and Constance Newman Who Has Time To Cook? How Family Resources Influence Food Preparation May 2007. USDA ERRN 40. http://www.ers.usda.gov/publications/ERR40/err40.pdf
Quantity Quality Tradeoff in Fertility Behavior How do wages affect household size?
Mammen, Kristen and Christina Paxson. “Women’s Work and Economic Development.” Journal of Economic Perspectives 14 (Fall 2000): 141-162.
Mammen, Kristen and Christina Paxson. “Women’s Work and Economic Development.” Journal of Economic Perspectives 14 (Fall 2000): 141-162.
How should spouses divide market and home time? How do relative wages affect time allocation?
Weekly Hours Spent in Work and Leisure by Men and Women,Age 25-64, in the United States, 1965–1981
Average time in home production per week for married men and women Men 17.7 Women 29.8 Men spend 9 more hours per week in the labor market Hersch and Stratton, Journal of Human Resources, Winter 2002.
Bureau of Labor Statistics. “Variations in Time Use at Stages of the Life Cycle.” Monthly Labor Review 128 (September 2005): 38-45.
Father Bureau of Labor Statistics. “Variations in Time Use at Stages of the Life Cycle.” Monthly Labor Review 128 (September 2005): 38-45.
Minutes per day spent in total market and nonmarket work for men and women, 21 countries Equal minutes per day Fitted line, nonMeditaranean countries Fitted line, Meditaranean countries U.S. difference is 4 minutes Michael Burda, Daniel Hamermesh, and Philippe Weil. 2006. "TOTAL WORK, GENDER AND SOCIAL NORMS,"