Download
1 / 15
150 likes | 309 Views
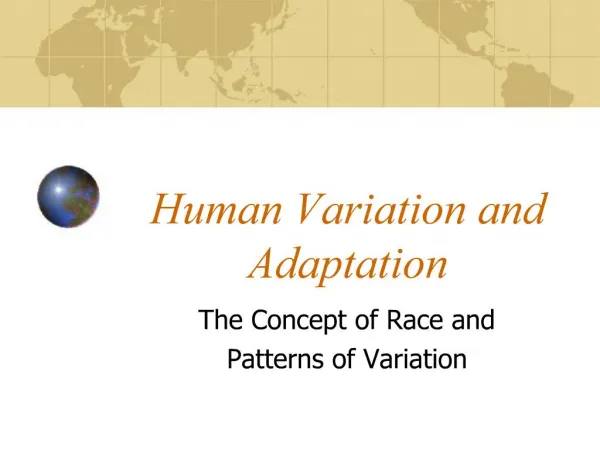
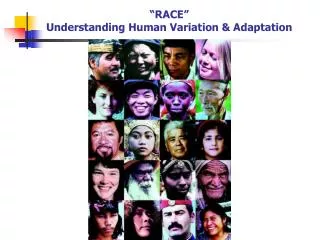
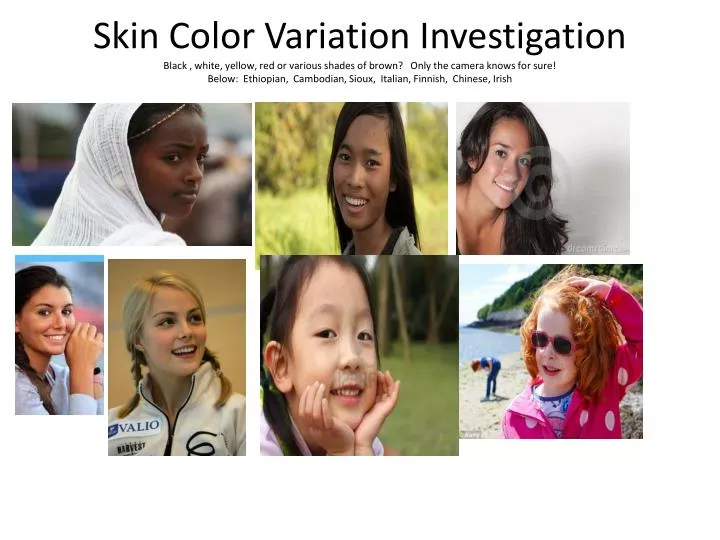
Skin Color Variation Investigation B lack , white, yellow, red or various shades of brown? Only the camera knows for sure! Below: Ethiopian, Cambodian, Sioux, Italian, Finnish, Chinese, Irish. Human Variation in Skin Color and Race as a Social Construct.

E N D
Skin Color Variation InvestigationBlack , white, yellow, red or various shades of brown? Only the camera knows for sure!Below: Ethiopian, Cambodian, Sioux, Italian, Finnish, Chinese, Irish
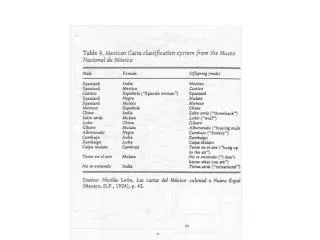
Human Variation in Skin Color and Race as a Social Construct • This lesson is part of evolution unit which follows heredity and genetics • The lesson is interdisciplinary in nature in that I discuss the concept of race as a social construct and the idea that there are “black, white, red, yellow” skinned people is something that people developed. It is not based on biology. Race groupings are human-made groups. • Students first learn about mixing light and how to determine black and white from an ADI analysis. They learn that red and green = yellow, etc. • They then photograph each other’s forearms and analyze the images using ADI. • We then discuss skin color as an adaptive advantage. • I reinforce the idea that people’s skin color (before there was sunscreen, folic acid, and Vitamin D supplements) was an adaptation which enabled people to survive. I point out to the students that they come from a long line of WINNERS(otherwise they wouldn’t be here! )
What observations can we make from the graphs of RGB values from photos taken of students from various backgrounds/ethnicities? • The next series of slides shows RGB values and color graphs for 5 of my students. I have included their photos and their self-described racial/ethnic group. Can you match the graph with the photo? What is the same with all of the graphs? What is different?
Answers • Photo #1 = graph 4 • Photo #2 = graph 5 • Photo #3 = graph 1 • Photo #4 = graph 2 • Photo #5 = graph 3