Download
1 / 1
10 likes | 91 Views
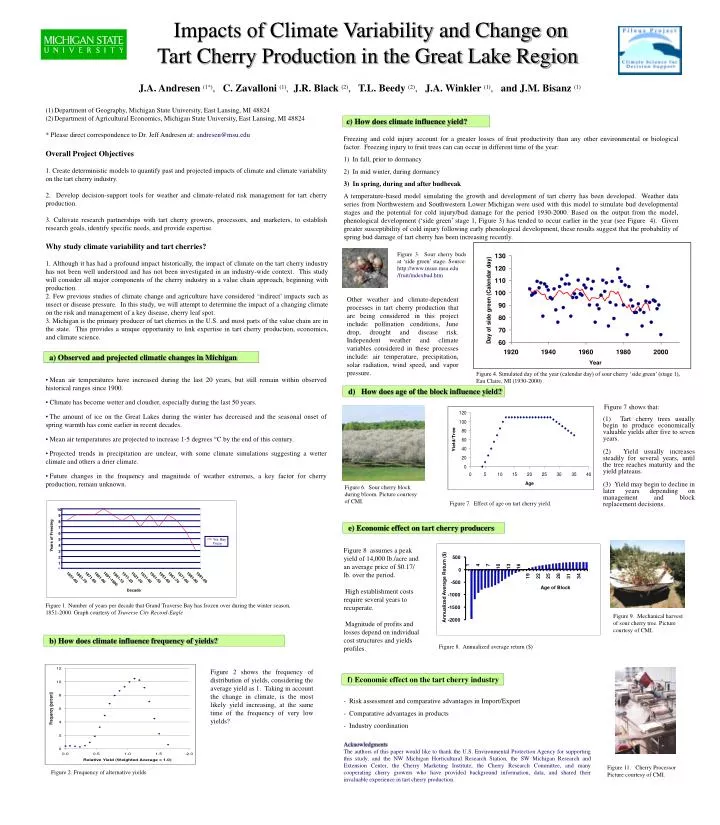
10. 9. 8. 7. 6. Years of Freezing. 5. Yrs. Bay. Froze. 4. 3. 2. 1. Figure 1. Number of years per decade that Grand Traverse Bay has frozen over during the winter season, 1851-2000. Graph courtesy of Traverse City Record-Eagle. 0. 1851-60. 1871-80. 1921-30. 1981-90. 1991-00.

E N D
10 9 8 7 6 Years of Freezing 5 Yrs. Bay Froze 4 3 2 1 Figure 1. Number of years per decade that Grand Traverse Bay has frozen over during the winter season, 1851-2000. Graph courtesy of Traverse City Record-Eagle 0 1851-60 1871-80 1921-30 1981-90 1991-00 1861-70 1881-90 1901-10 1911-20 1931-40 1941-50 1951-60 1961-70 1971-80 1891-1900 Decade 500 1 4 7 10 13 16 0 19 22 25 28 31 34 -500 Annualized Average Return ($) Age of Block -1000 -1500 -2000 Impacts of Climate Variability and Change on Tart Cherry Production in the Great Lake Region J.A. Andresen (1*), C. Zavalloni (1), J.R. Black (2), T.L. Beedy (2), J.A. Winkler (1), and J.M. Bisanz (1) • Department of Geography, Michigan State University, East Lansing, MI 48824 • Department of Agricultural Economics, Michigan State University, East Lansing, MI 48824 • * Please direct correspondence to Dr. Jeff Andresen at: andresen@msu.edu c) How does climate influence yield? Freezing and cold injury account for a greater losses of fruit productivity than any other environmental or biological factor. Freezing injury to fruit trees can can occur in different time of the year: 1) In fall, prior to dormancy 2) In mid winter, during dormancy 3) In spring, during and after budbreak A temperature-based model simulating the growth and development of tart cherry has been developed. Weather data series from Northwestern and Southwestern Lower Michigan were used with this model to simulate bud developmental stages and the potential for cold injury/bud damage for the period 1930-2000. Based on the output from the model, phenological development (‘side green’ stage 1, Figure 3) has tended to occur earlier in the year (see Figure 4). Given greater susceptibility of cold injury following early phenological development, these results suggest that the probability of spring bud damage of tart cherry has been increasing recently. Overall Project Objectives 1. Create deterministic models to quantify past and projected impacts of climate and climate variability on the tart cherry industry. 2. Develop decision-support tools for weather and climate-related risk management for tart cherry production. 3. Cultivate research partnerships with tart cherry growers, processors, and marketers, to establish research goals, identify specific needs, and provide expertise. Why study climate variability and tart cherries? 1. Although it has had a profound impact historically, the impact of climate on the tart cherry industry has not been well understood and has not been investigated in an industry-wide context. This study will consider all major components of the cherry industry in a value chain approach, beginning with production. 2. Few previous studies of climate change and agriculture have considered ‘indirect’ impacts such as insect or disease pressure. In this study, we will attempt to determine the impact of a changing climate on the risk and management of a key disease, cherry leaf spot. 3. Michigan is the primary producer of tart cherries in the U.S. and most parts of the value chain are in the state. This provides a unique opportunity to link expertise in tart cherry production, economics, and climate science. Figure 3. Sour cherry buds at ‘side green’ stage. Source: http://www.msue.msu.edu /fruit/indexbud.htm Other weather and climate-dependent processes in tart cherry production that are being considered in this project include: pollination conditions, June drop, drought and disease risk. Independent weather and climate variables considered in these processes include: air temperature, precipitation, solar radiation, wind speed, and vapor pressure. a) Observed and projected climatic changes in Michigan Figure 4. Simulated day of the year (calendar day) of sour cherry ‘side green’ (stage 1), Eau Claire, MI (1930-2000) . • Mean air temperatures have increased during the last 20 years, but still remain within observed historical ranges since 1900. • Climate has become wetter and cloudier, especially during the last 50 years. • The amount of ice on the Great Lakes during the winter has decreased and the seasonal onset of spring warmth has come earlier in recent decades. • Mean air temperatures are projected to increase 1-5 degrees C by the end of this century. • Projected trends in precipitation are unclear, with some climate simulations suggesting a wetter climate and others a drier climate. • Future changes in the frequency and magnitude of weather extremes, a key factor for cherry production, remain unknown. d) How does age of the block influence yield? Figure 7 shows that: (1) Tart cherry trees usually begin to produce economically valuable yields after five to seven years. (2) Yield usually increases steadily for several years, until the tree reaches maturity and the yield plateaus. (3) Yield may begin to decline in later years depending on management and block replacement decisions. Figure 6. Sour cherry block during bloom. Picture courtesy of CMI. Figure 7. Effect of age on tart cherry yield. e) Economic effect on tart cherry producers Figure 8 assumes a peak yield of 14,000 lb./acre and an average price of $0.17/ lb. over the period. High establishment costs require several years to recuperate. Magnitude of profits and losses depend on individual cost structures and yields profiles. Figure 9. Mechanical harvest of sour cherry tree. Picture courtesy of CMI. b) How does climate influence frequency of yields? Figure 8. Annualized average return ($) Figure 2 shows the frequency of distribution of yields, considering the average yield as 1. Taking in account the change in climate, is the most likely yield increasing, at the same time of the frequency of very low yields? f) Economic effect on the tart cherry industry • Risk assessment and comparative advantages in Import/Export • Comparative advantages in products • - Industry coordination Acknowledgments The authors of this paper would like to thank the U.S. Environmental Protection Agency for supporting this study, and the NW Michigan Horticultural Research Station, the SW Michigan Research and Extension Center, the Cherry Marketing Institute, the Cherry Research Committee, and many cooperating cherry growers who have provided background information, data, and shared their invaluable experience in tart cherry production. Figure 11. Cherry Processor Picture courtesy of CMI. Figure 2. Frequency of alternative yields