Download

1 / 32
320 likes | 434 Views
A Second Look at Striping. Stan Kidder 5 Oct 2012. Methodology. VIIRS SDR radiances were examined on two dates, 9 April 2012 and 29 September 2012 Examined the middle 37% of the elements (which are not subject to bow-tie deletions)

E N D
A Second Look at Striping Stan Kidder 5 Oct 2012
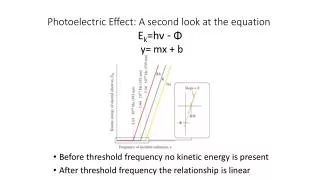
Methodology • VIIRS SDR radiances were examined on two dates, 9 April 2012 and 29 September 2012 • Examined the middle 37% of the elements (which are not subject to bow-tie deletions) • Examined 22 granules (1056 scans) on 9 April and 25 granules (1200 scans) on 29 September near CONUS and near 1330 local time • For each band, the mean radiance for each scan line minus the overall mean radiance was divided by an estimate of noise for each band. This is called the Normalized Deviation.
Noise (Estimated from measured SNR or NEDT)
M6 Range of Normalized Deviations Black = saturation?
M13 Odd- and even-line striping Range of Normalized Deviations Range of data may mask striping in this image
M10 Range of Normalized Deviations
M3 Range of Normalized Deviations
M7 Range of Normalized Deviations
M1 Range of Normalized Deviations
M2 Range of Normalized Deviations
M8 Range of Normalized Deviations
M4 Range of Normalized Deviations
M5 Range of Normalized Deviations
M12 Odd- and even-line striping Range of Normalized Deviations
I3 Range of Normalized Deviations
I1 Range of Normalized Deviations
I2 Range of Normalized Deviations
M15 Odd- and even-line striping Range of Normalized Deviations
M16 Range of Normalized Deviations
I4 Odd- and even-line striping Range of Normalized Deviations
M14 Range of Normalized Deviations
M11 Range of Normalized Deviations
I5 Odd- and even-line striping Range of Normalized Deviations
M9 Range of Normalized Deviations
Conclusions (1/2) • Results are similar in April and September cases. • The M6 striping is smaller in September than it was in April, but is still very large. Also, there appear to be saturation issues. • Some channels seem to have odd- and even-line striping. • Some of the differences between September and April may be caused by real scene effects.
Conclusions (2/2) • Comparing with noise is interesting and useful, but whether or not one can see striping depends on the magnitude of striping in comparison with the range of data in a scene. It is difficult to see any evidence of striping in the M13 image, for example, even though statistically M13 has the second largest striping (compared to noise).
From previous study Backup Slides
I1 0.64mm Very small deviation from Block Mean Radiance No noticeable striping Highly Enhanced Image
M6 – 0.747 m Very Large Striping Unenhanced Image
M13 – 4.05 m Moderate deviations from Block Mean Radiance, but hard to find striping
M10 – 1.61 m Moderate deviations—some striping visible in unenhanced image