Download
1 / 36
360 likes | 390 Views
This presentation provides a historical overview of visualization in mathematics education, exploring its definition, different examples, and its influence on learning and curriculum development. It also discusses the implications of incorporating visualization skills in the school mathematics curriculum.

E N D
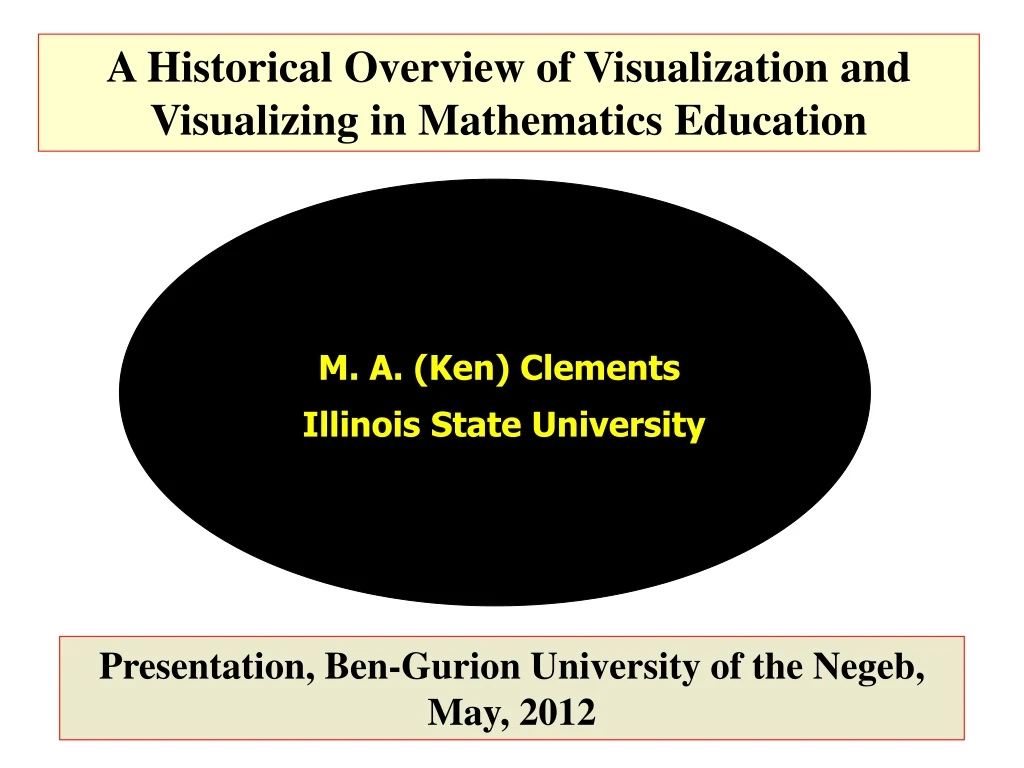
A Historical Overview of Visualization and Visualizing in Mathematics Education M. A. (Ken) Clements Illinois State University Presentation, Ben-Gurion University of the Negeb, May, 2012
What “Visualization” Means for Me Visualization involves the construction of visual images and/or mental transformation of images of real or conceptual objects. An imagined object might be, for example, a cube, or the Cartesian graph of y = sin t. If I visualize the Cartesian graph of y = sin t, and imagine translating that graph /4 units “to the right” then I begin to “see” the transformed graph for y = sin(t – /4). Then, dilating that graph from the horizontal axis by 2, and translating that new graph 1 unit “upwards,” I begin to “see” the graph of y = 1 + 2 sin(t – /4). Indeed, I can “see” that the range of the function whose graph I now have is {y: –1 y 3, y R}. If I look hard enough I can still see the original graph of y = sin t on the same Cartesian plane.
Another Example of Visualization If a teacher asked students to work out how many football matches could be played between four teams, each team playing each other once, then it is possible that some students might construct a visual image of a square with its two diagonals and, by counting the joins from vertex to vertex, arrive at the answer “six.” A student who did this might have engaged in a creative act of visualization. I said “might have” because if the person had seen the problem before, and perhaps had been shown the “square-with-diagonals” method, then the method of mentally constructing the square and counting the joins would not have been creative—but it would still have involved visualization, as I am using that term. Mentally counting the joins also would involve visualization.
What “Visualization Means for Me (Cont’d) By contrast, someone who answered the last question by finding the value of 4C2 would probably not have “visualized.” That would be a verbal-analytic response. Note that this verbal-analytic response might be regarded as mathematically more sophisticated, or advanced, than the “counting-the-joins” method. Another aspect of visualization occurs when I have some imagined object in my mind and I then mentally change my vantage point with respect to the imagined object (as in the famous Piagetian “three mountains” task). What does “Visualization” mean for you?
Visualization and School Mathematics, 20th Century Influences 1. Mathematicians (e.g., Hilbert): strong emphasis throughout the twentieth century. 2. Behaviorist Psychologists? (1914 onwards). Basically no influence, because they didn’t believe in visual imagery—their emphasis was on behavioral outputs that can be observed. Key figures are Watson, Thorndike, Skinner, Spady. 3. Factor Analysts (Up to about 1980: e.g., Thurstone): aimed to distinguish different types of mental (including visual) processing. 4. Developmental Psychologists (1950–1990, especially Piaget and Inhelder). How does a child learn to handle imagery and space over time? “Topological” thinking preceded “Euclidean” thinking. 5. Cognitive Psychologists (beginning with Bruner, c. 1956). What’s going on in the mind? Key figures are Kosslyn, Paivio, Pylyshyn, Shepard. Continuing emphasis throughout 1956-2012. 6. Mathematics Educators (1970 onwards, including those interested in concept images, effects of visual teaching on learning)
6. Software Developers (e.g., LOGO, GSP) • Factor Analysts and Cognitive Psychologists 5. Post-1985 Mathematics Educators 2. Developmental Psychologists 3. Mathematicians 4. Pre-1985 Mathematics Educators Visualization and Mathematics Learning: Historical Overview Identifiable, but Isolated Influences
Visualization in School Mathematics: Issues 1. What does the term “visualization” encompass, so far as school mathematics is concerned? 2. To what extent should the need to develop visualization skills be a conscious part of the intendedschool mathematics curriculum? What are implications for curriculum developers, textbook writers, and external examiners? 3. How can we make sure that visualization is incorporated into the implementedschool mathematics curriculum? Should teachers attempt to change students’ preference for algorithms and verbal-logical thinking towards a preference for more visual modes? 4. Should we consciously demand visual forms of mathematics when assessing the attainedcurriculum?
Nongnuch Wattanawaha’s DIPT Classification Framework for Spatial Tasks Dimension (3 values) 1: The response revealed 1-D thinking (but not 2- or 3-D thinking). 2. The response revealed 2-D thought (but not 3-D thinking). 3. The response revealed 3-D thinking. Internalization (3 values) 0. The task was done at the perceptual level. There was no attempt to evoke a visual image, or the only visual image was a “duplicate” of a given stimulus, or an image corresponding to a simple transformation of the stimulus, or parts of it. 1. A visual image was evoked, but in order to do the task, thinking only needed to about aspects of the image—that is to say, it remained fixed in the mind. 2. Not only was a visual image evoked, but in working on the task that image was operated upon (“transformed”) in the mind.
DIPT (Cont’d) (Ref: Wattanawaha & Clements, Journal of Educational Psychology, December 1982) Presentation (3 values) 0. The form of the expected response to the task did not require a mental image to be described, identified, or drawn on paper. 1. The expected response had to be chosen from a number of different images (presented in pictorial form) or actions. The pictorial images or actions corresponded to the final visual image associated with the task. 2. The expected response required the final visual image to be drawn on paper, or otherwise described using words or hand or other movements. Thought Process (2 values) 0. The task specified the mental operations that had to be carried out. 1. The task did not specify the mental operations that had to be carried out, but enough information was given to enable an appropriate sequence of operations to be determined.
Wattanawaha: Interesting gender difference findings Wattanawaha (1977) analyzed responses to 72 carefully-developed pencil-and-paper spatio-mathematical tasks by a representative sample of 2346 students in grades 7 through 9 (1201 males, 1145 females) in Victoria, Australia. The 72 questions were from Wattanawaha’s (1977) Monash Spatial Thinking test, which had been developed by using item response theory, and was subsequently subjected to rigorous factor analyses by psychologists. It was found to be an excellent test, with very high loadings on what psychologists called “Visualization” (Eliot & Macfarlane-Smith, 1983). Wattanawaha and Clements (1982) reported that whereas on none of the 72 tasks on the Monash Spatial Thinking test, females significantly outperformed the males, the males significantly outperformed the females on 25 of the 72 tasks. Of those 25 tasks, 21 had an “Internalization” value of 2. Tasks with D = 3 and I = 2 were particularly well done by males (in comparison with females).
Wattanawaha’s (1977 H-Task):“If the H-shape in Fig. 1 was placed in the position shown in Fig. 2, what would be the letters for the Corners 1 and 2?”
c.f., the “H-task” strategies, and the following statement by Burin, Delgado and Prieto (2000), psychologists working from a factor-analytic perspective. ... Two general kinds of solution strategies for Vz tasks are described in the literature. One is an analytic or feature comparison approach, in which the examinee seeks to verify the identity of key features of the probes to match them with the target stimulus. A variant of this analytic strategy is verbal labeling of the features. The other is a holistic or spatial manipulation strategy, which involves mental movements of the probes, such as rotation, translation, synthesis, etc. We have focused on a typical Vz task, the puzzle or form board. In this case, an analytic strategy consists of comparing features (sides, angles, form of parts) of the target stimulus with features of the alternative parts. The holistic approach involves putting together all or some of the alternative parts in order to form a mental image which is compared with the target stimulus. (p. 277)
Different Students Process the Same Spatio-Mathematical Task in Different Ways Clements and Wattanawaha (1978) observed and, whenever necessary, questioned, 328 interviewees (from grades 7, 8 and 9) who introspected through 16 spatio-mathematical tasks suitable for lower-secondary school students. They concluded that “the range of strategies employed ... was amazing.” With one of the interview tasks, for example, interviewees, on being handed a model of a cube and shown what an “edge” was, were asked to state how many edges the cube had altogether. ... About 30 percent of the interviewees did not answer correctly, and those who did answer correctly used a wide range of methods. Some of the responses were very “visual,” others were not, and for some it was difficult to decide one way or the other (e.g., how could one classify the response: “There are six faces, each has four edges. Six multiplied by 4 is 24 which, when divided by 2 is 12”?)
Implications for math- matics education are still being worked out today! Gagné & White, (1978) Impact of teaching method on cognitive structures: Mackenzie & White, 1982 Verbal, Skills, Imagery, Attitudes, Episodes Vinner, Tall, Dreyfus, Eisenberg, Hershkowitz (1980–1989) In the 1980s, the Cognitive-Structure/Concept-Image Researchers Made a Massive Contribution to Research on How Learners Think About Mathematics Long-Term Memory Structure
Tall & Vinner (1981) “We shall use the term concept image to describe the total cognitive structure that is associated with the concept, which includes all the mental pictures and associated properties and processes. ... As the concept image develops it need not be coherent at all times. ... We shall call the portion of the concept image which is activated at a particular time the evoked concept image. At different times, seemingly conflicting images may be evoked. Only when conflicting aspects are evoked simultaneously need there be any actual sense of conflict or confusion.” (p. 152)
PME 15 (1991) Plenary Addresses Relating to Visualization in Mathematics Education by Dörfler and Dreyfus Dreyfus, PME 15 (Assisi, 1991): “On the status of visual reasoning in mathematics and mathematics education” “It is therefore argued that the status of visualization in mathematics education should and can be upgraded from that of a helpful learning aid to that of a fully recognized tool for learning and proof” (p. 33). Dörfler, PME 15 (Assisi, 1991): “One can assume that meaning (subjectively) is not solely of a propositional and linguistic character, but is based essentially on mechanisms which appear to be explainable by being objective-concrete and geometric-schematic. ... Image schemata are acquired and learned by the bodily experience of the individual.” (p. 20)
A Tribute The preparation of this paper has been a moving experience for me, in two ways. First, it moved me to examine the writings of Ted Eisenberg, Tommy Dreyfus, and others within a very hardworking and high-achieving group of Israeli mathematics education scholars. I have been reminded that these writings are—and I choose these adjectives carefully—courageous, creative and powerful. Some of them—like, for example, Eisenberg and Dreyfus’s (1991) “On the Reluctance to Visualize,” Dreyfus and Eisenberg’s (1986) “On the Aesthetics of Mathematical Thought,” and Eisenberg’s (2008) “Flaws and idiosyncrasies in mathematicians ...”—have had a significant impact on my own thinking.
A Tribute (Cont’d) The second influence on me, personally, was to reignite my own interest in the role of visual thinking in mathematics and mathematics education. I trust that this talk will not only attest to my re-emerging interest, but by so doing pay tribute to the pioneering and persistent work in the field by—in alphabetical order—Miriam Amit, Alan Bishop. Tommy Dreyfus, Ted Eisenberg, Michael Fried, Rina Hershkowitz, Kay Owens, Norma Presmeg, Richard Skemp, Schlomo Vinner, and David Tall.
Norma Presmeg’s Definition of Visualization, and Related Comment on Needed Pedagogy “Following Piaget and Inhelder (1971), the position is taken that when a person creates a spatial arrangement (including a mathematical inscription) there is a visual image in the person’s mind, guiding this creation. Thus visualization is taken to include processes of constructing and transforming both visual mental imagery and all of the inscriptions of a spatial nature that may be implicated in doing mathematics” (Presmeg, 1997b). (p. 206) “An ongoing and important theme is the hitherto neglected area of how visualization interacts with the didactics of mathematics. Effective pedagogy that can enhance the use and power of visualization in mathematics education ... is perhaps the most pressing research concern at this period: very few studies have addressed this topic ...” (Presmeg, 2006)
Comparing Presmeg’s and Dorfler’s Types of Imagery (from Presmeg, 2006) Presmeg’s (1985) Type of Imagery Dörfler’s Image Schemata Figurative (purely perceptive) Concrete Imagery Kinaesthetic imagery Operative Dynamic imagery Relational Memory imagery Symbolic image schemata Pattern imagery
Stephanus Suwarsono’s (1982) Mathematical Processing Instrument In 1981 I presented a paper at the Annual Meeting of the American Educational Research Association (in Los Angeles), on the influence of spatial abilities and visual imagery on mathematical thinking. I remember asking the 100 or so people present at my talk to attempt to solve Wattanawaha’s H-shape task. After a minute or so, I asked those present to indicate whether they had used either of the two following methods to find the label for “Corner 1”? I said ... Did you imagine the shape in Fig. 1 being rotated and turned, so that it matched the shape in Fig. 2 (and then work out that the letter J would be at Corner 1? Or, … Did you avoid imagining the transformation by thinking along the following lines? “In Fig. 2, Corner 1 is at the far opposite corner from Corner D, and in Fig. 1, Corner J is at the far opposite corner to Corner D. Thus, Corner 1 must be Corner J.”
Same Task, Different Methods ... Quite a few of those present at the talk confessed that they had not been able to solve the problem in the time I allowed (which was about 1 minute). Of those who indicated that that was the case, most said they were had been attempting to use a method like Method 1 (the holistic, mental-rotation approach). About one-fourth of those present indicated that they had used Method 1 and got the right answer; and another one-fourth said they had used that method, but had been unable to complete the task. About one-third indicated that they had used Method 2, and got the right answer. I also presented other spatio-mathematical questions (from Wattanawaha (1977), and was able to demonstrate that different people, very capable at mathematics and competent spatially, often used different methods when attempting mathematical tasks that seemed to have a visual or spatial dimension.
Used by Lean & Clements (1981) in PNG Developed through IRT (advanced form) Students with high spatial ability often preferred to use verbal-analytic methods on mathematics tasks Two components (mathematics tasks and questionnaire) “Student Preference for Visuality” and “Question Visuality” calibrated on the same scale (ANA-VIS) Found that Students with strong Vz preference often used visual methods even on highly verbal-analytic tasks The MPI Instrument is Still Used in the United States by Psychologists, but Rarely by Mathematics Educators MPI (Suwarsono, 1982)
Here are Five Questions from the MPI. One is a highly “visual question” on the ANA-VIS scale. Which is it? • John is taller than Mary. John is shorter than Jane. Who is the tallest? • Two years ago Mary was 8 years old. How old will she be five years from now? • One morning a boy walked from home to school. When he got half-way he realized that he had forgotten to bring one of his books. He then walked back to get it. When he finally arrived at school, he had walked 4 km altogether. What was the distance between his home and school? • A mother is seven times as old as her daughter. The difference between their ages is 24 years. How old are they? • A girl had 11 plums. She decided to swap the plums for some apples. Her friend, who had the apples, said: “For every 3 plums, I will give you an apple.” After the swap, how many plums did the girl have?
Here are the ANA-VIS Calibrations : About 40 is very visual, 50 is average, and about 60 is very verbal-analytic • John is taller than Mary. John is shorter than Jane. Who is the tallest? 46.8 • Two years ago Mary was 8 years old. How old will she be in five years from now? 60.6 (very verbal-analytic) • One morning a boy walked from home to school. When he got half-way he realized that he had forgotten to bring one of his books. He then walked back to get it. When he finally arrived at school, he had walked 4 km altogether. What was the distance between his home and school? 38.8 (very visual) • A mother is seven times as old as her daughter. The difference between their ages is 24 years. How old are they? 55.3 • A girl had 11 plums. She decided to swap the plums for some apples. Her friend, who had the apples, said: “For every 3 plums, I will give you an apple.” After the swap, how many plums did the girl have? 51.2 (average)
This “balloon” problem, first created by Suwarsono, was used in many U.S. research studies (1983-2012) “A balloon first rose 200 m from the ground, then moved 100 m to the east, and then dropped 100 m. It then travelled 50 m to the east, and finally dropped straight to the ground. How far was the balloon from its starting point?” (Suwarsono, 1982, p. 292) Predict its ANA-VIS calibration? 40.6, based on lower-secondary sample in Melbourne (Australia), and 41.2 based on a sample of engineering students in PNG. Sample-free ANA –VIS calibrations!
MPI also measures the degree of preference for “visual” thinking (or “verbal-analytic “thinking) on ANA-VIS Here are three tasks in the PNG version of MPI. PROBLEM 1: Tau has more money than Dilli, and Mike has less money than Dilli. Who has the most money? PROBLEM 2: In an athletics race, Johnny is 10 m ahead of Peter, Tom is 4 m ahead of Jim, and Jim is 3 m ahead of Peter. How many metres is Johnny ahead of Tom? PROBLEM 3: Jack, Luke and Kuni all have birthdays on the 1st January, but Jack is 1 year older than Luke and Jack is three years younger than Kuni. If Kuni is 10 years old, how old is Jack?
Here is the set of solutions prepared by a student whose ANA-VIS score indicated a strong preference for verbal-analytic methods. (1) Tau 3x (2) John 10 m to Peter x m Dilli 2x Tom 4 m to Jim x m Mike x Jim 3 m to Peter x m Tau has more money.John to Tom? (3) KuniJo P Jo – P 5x + 2x + x 10 m to 0 10 – 0 = 10 If Kuni = 10 yr old Jim P Jo – Jim 5x – 2x = 3x 3 to 0 10 – 3 = 7 10x – 3x = 7x Tom 4 m to 5 = 10 – 3 – 4 = 3 Jack is 7 years old. John 3 metres ahead of Tom. This student was the top mathematics student in a class of 116 engineering students. He also got the highest spatial ability score!
Here is the set of solutions prepared by a student with a strong preference for visual methods Tau has the most money. If Jim is 3 m ahead of Peter then Tom is 7 m ahead of Peter, and if John is 10 m ahead of Peter, then John is 3 m ahead of Tom. Jack is 7 years old.
Developing “Visual” Methods with Prospective Teachers of Mathematics • Project Task (Counts for 25% of total grade) • Students work in pairs (they do not choose their partner); • Pairs are allocated to tasks that are intended to encourage visual thinking and generalization; • Each student first attempts his/her tasks individually; • Then each student in a pair compares his/her solution with that of the other person in the pair; • Pairs then comes to see me to discuss their task; • Pairs then teach the whole class about their problem; • Pairs write a report on the their approaches to the task, and on their teaching of the task; • Pairs then create two “examination” questions (one “simple,” one “challenging”) related to their task.
Clockface Algebra: An Example of Project Task “Suppose, on a circular clockface the time shows exactly 12 noon. Assuming the clock is working well, how many minutes (to 1 decimal place) will it take before the minute hand and the hour hand are pointing in exactly the same direction again?” In the description of the task a circular clockface is not shown, and it is a matter of interest whether a pair of students, working on this task, immediately set about drawing a circular clockface. They usually do, but sometimes they do not. Another common starting point with the students is to try to set up an equation involving x (although the meaning of this variable is rarely well defined).
After much mental effort, sometimes to the point of despair, each pair develops and make sense of an equation like 6t = 360 + t /2 This mathematizationphase is very difficult for the students, and when they teach the class (the pedagogicalphase ) they have to take great care that their fellow students develop appropriate thought processes. The next stage is the problem-posingstage. It is an expectation that each pair of students pose two related problems that will be suitable for other members of the class to solve after some instruction. The next slide will show some of the problems that the students have created. During this problem-posing phase the students are encouraged to think laterally, and to take advantage of diagrams.
Problems Created by the Students: These Four are Standard. If the time is 3:10, how long will it take before the two hands point in exactly the same direction? If the time shows 9:50, how long would it take before thetwo hands point in exactly the same direction? How many times in any 12-hour period will the two hands point in exactly the same direction? Suppose after noon the hour-hand moved backwards (i.e., counter-clockwise) at its normal rate, but the minute-hand moved forward at its normal rate. How long would it take before the two hands were pointing in exactly the same direction? Each is rather pedestrian, yet still interesting. But, ....
... How about these Three Questions? Where Would They be on the ANA-VIS Scale? On a long straight road, CarA, which is traveling at 60 mph, is 5 miles behind Car B, which is travelling at 40 mph. Assuming that they continue to travel at those speeds, how long will it take for Car A to catch Car B? On a long straight road, CarA, which is traveling at a mph, is d miles behind Car B, which is travelling at b mph. Assuming that a > b, and that they continue to travel at those speeds, how long will it take for Car A to catch Car B? Suppose TrainA leftCity A and traveled at a mph toward City B, which was d miles from City A. At the same time, Train B, began traveling at b mph toward City B. If the two trains continued to travel at those speeds, how long would it have been before Train A and Train B met?
These prospective teachers all began to draw diagrams, and to reflect on what the relevant variables were, and how they should be defined. There can be no doubt that they began to represent the problems, internally, in multiple ways (Amit & Fried, 2005). Presmeg (1985) suggested that teachers need to be assisted to help visualizer-students in their mathematics classes to overcome their difficulties and exploit their strengths in order that they (the teachers) will become more confident in planning learning environments in which students will visualize their way toward deeper knowledge of important mathematics. I certainly agree with that, and feel the discussion of the clockface-algebra example above points the way ahead. It shows a pedagogical approach that is likely to help teachers achieve the ends desired.