Download
1 / 31
310 likes | 427 Views
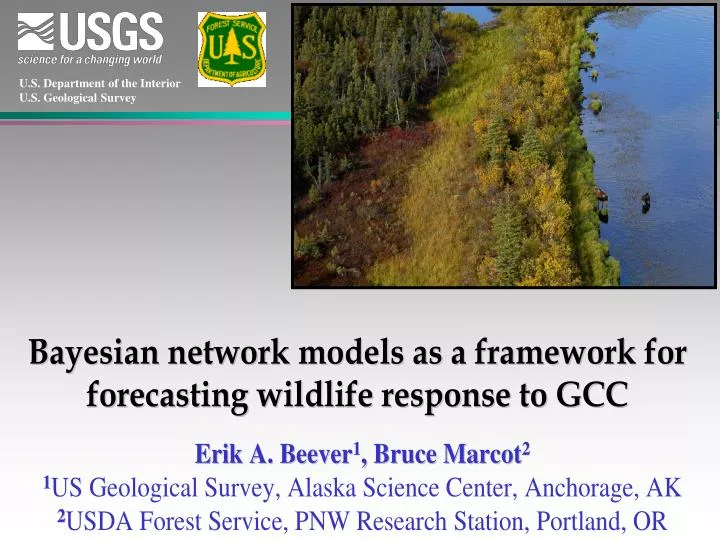
U.S. Department of the Interior U.S. Geological Survey. Initial thoughts: challenges ahead. field data expert knowledge. We’d like to incorporate both empirical & experiential info Graphical framework whose transparency allows dev’t & evaluation by many user groups

E N D
U.S. Department of the Interior U.S. Geological Survey
Initial thoughts: challenges ahead field data expert knowledge • We’d like to incorporate both empirical & experiential info • Graphical framework whose transparency allows dev’t & evaluation by many user groups • Causal relationships among variables may articulate mechanisms • Uncertainty inherent in ecosystems leads to use of probabilities • We’d like to know what factors model is most sensitive to
What to monitor… & what it tells us • Conservation practitioners have wrestled with the question of what to track, given limited funds • Umbrellas • Flagships • Keystones • Key envir. correlates, Key ecological F(x)s (ICBEMP) • Focal spp. (Lambeck 1999) • Indicator spp. – Guilds • Rare vs. common spp. (Scott et al. 1995) Unfortunately, there simply are no silver bullets…
Bayesian network models: Basics • Relate to prior and posterior probabilities • Rely on Bayes’ theorem • P (S | H) = • Explicitly show probabilities of each state in each node P (H | S) * P (S) P (H) S = species abundance, presence H = habitat conditions With probabilities (quantitative) Influence diagram (graphical)
Bayesian network models: Strengths • Allow combining of data of differing quality, level of certainty
Bayesian network models: Strengths • Allow combining of data of differing quality, level of certainty • Explicitly transparent : allow inspection by various user groups
Bayesian network models: Strengths • Allow combining of data of differing quality, level of certainty • Explicitly transparent : allow inspection by various user groups • Sensitivity analyses allow great learning …
Bayesian network models: Strengths • Allow combining of data of differing quality, level of certainty • Explicitly transparent : allow inspection by various user groups • Sensitivity analyses allow great learning … • Relationships can be linear or of any other form; nodes can incorporate continuous or discrete f(x)’s (e.g., HSI)
Bayesian network models: Strengths • Allow combining of data of differing quality, level of certainty • Explicitly transparent : allow inspection by various user groups • Sensitivity analyses allow great learning … • Relationships can be linear or of any other form; nodes can incorporate continuous or discrete f(x)’s (e.g., HSI) • Allow for ‘intelligent tinkering’, exploration of alternative future mgmt options, & updating
Bayesian network models: Strengths • Allow combining of data of differing quality, level of certainty • Explicitly transparent : allow inspection by various user groups • Sensitivity analyses allow great learning … • Relationships can be linear or of any other form; nodes can incorporate continuous or discrete f(x)’s (e.g., HSI) • Allow for ‘intelligent tinkering’, exploration of alternative future mgmt options, & updating • Can use informed (hypothesis- or data-driven), or uninformed (equal prob) prior probabilities
Bayesian network models: Limitations • Veracity depends on understanding of species’ life-histories, ecologies, and on the nature of relationships among var’s
Bayesian network models: Limitations • Veracity depends on understanding of species’ life-histories, ecologies, and on the nature of relationships among var’s ‘in’ ‘out’
Bayesian network models: Limitations • Veracity depends on understanding of species’ life-histories, ecologies, and on the nature of relationships among var’s • May need to be updated, if nature of relationships changes
Bayesian network models: Limitations • Veracity depends on understanding of species’ life-histories, ecologies, and on the nature of relationships among var’s • May need to be updated, if nature of relationships changes radically • Results can be sensitive to initial conditions; some disagreement about what to use
Bayesian network models: Limitations • Veracity depends on understanding of species’ life-histories, ecologies, and on the nature of relationships among var’s • May need to be updated, if nature of relationships changes radically • Results can be sensitive to initial conditions; some disagreement about what to use • Others ?
Relationship to conceptual models Conceptual model (=influence diagram) • CMs directly convertible to Bayes networks; allow Id. of testable hypotheses Source: Marcot, B. G., et al. 2001. Forest Ecology and Mgmt 153(1-3):29-42.
Relationship to conceptual models Bayesian Network Model
Programs for creating conceptual models • PowerPoint • Mindjet MindManager Pro • Inspiration • Personal Brain • Netica • cMap * • FreeMind * * = freeware
Bayesian Network model: stressors on polar bear pop’s Conceptual model (=influence diagram)
Bayesian Network model: stressors on polar bear pop’s Conditional- probability table
Some of the devil(s) … • Complicated dynamics modeled tractably with sub-models • Coherency across spp., regions ?? • Spatially-explicit change requires more-intensive modeling effort, but the two can be linked by transition probabilities • How do we handle the different dynamics of pulse vs. press disturbances? unknown trajectories of dev’t? feedbacks, non-linear synergies, threshold dynamics, emergent properties? • Varying resolutions of constituent data may mean reverting to coarsest scale among data sources • Indep. of BBNs: The degree to which spp. are obligately tied to any available habitat variable differs, among spp.
Decision-support models: useful model attributes • probability-based • can still provide results when missing data • provides for sensitivity testing • provides management hypothesis (adaptive management) • incorporates new data to update model functions, probabilities, structure • allows rapid prototyping • combines expert judgment w/ empirical data; multiple experts.
Take-home messages • Work more like the human brain, compared to null-hypothesis testing • Require specialized expertise, program(s) to build and refine (e.g., Netica, Amos?), but it’s possible to learn • Provide a transparent means by which to probabilistically bound uncertainty