Download
1 / 16
170 likes | 440 Views
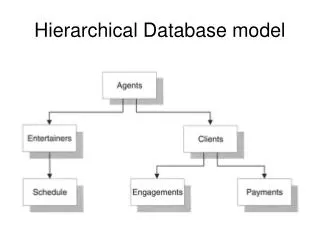
Hierarchical Database Screenings for HIV-1 Reverse Transcriptase Using a Pharmacophore Model, Rigid Docking, Solvation Docking, and MM-PB/SA. Junmei Wang, Xinshan Kang, Irwin D.Kuntz, and Peter A. Kollman Encysive Pharmaceuticals Inc. University of California, San Francisco

E N D
Hierarchical Database Screenings for HIV-1 Reverse Transcriptase Using a Pharmacophore Model, Rigid Docking, Solvation Docking, and MM-PB/SA Junmei Wang, Xinshan Kang, Irwin D.Kuntz, and Peter A. Kollman Encysive Pharmaceuticals Inc. University of California, San Francisco Presentation by Susan Tang CS 379A
Background • There are two approaches to identifying drug leads • De novo design • Aimed to design novel compounds that have electrostatic and hydrophobic properties complementary to target • Requires 3D structures of drug targets • Database screening • Applies filters to identify potential drug leads from databases • Can be divided into query-based and scoring-function-based methods • Only scoring-function-based methods requires 3D structures of drug targets • Query-based screenings - Search queries such as MW, #H-bond donors/acceptors, and pharmacophore models are applied to database - Computationally efficient since 3D structures are not used - Wrong query fields may produce too high/too low # of hits 2) Scoring-function based approaches - Apply target functions (typically free-energy calculations of inhibitor binding to target) to obtain hits - The most rigorous and accurate methods of free energy calculation are FEP (Free energy perturbation) and TI (Thermodynamic integration) but they are too computationally intensive and thus not appropriate for DB screening - There are several alternative methods as well (such as MM-PB/SA)
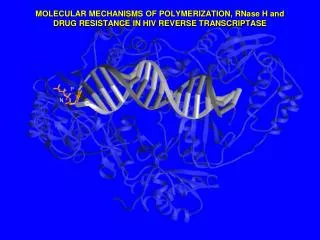
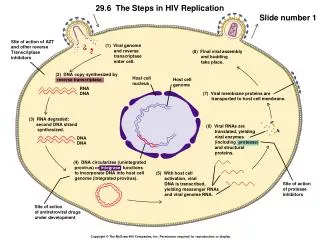
Purpose • Purpose: To develop a method for the identification of HIV-1 RT drug leads using hierarchical database screening • Sequential Methods Used 1) Pharmacophore model 2) Multiple-conformation rigid docking 3) Solvation docking 4) MM-PB/SA (Molecular Mechanics-Poisson-Boltzman/surface area) • Significance of HIV-1 Reverse Transcriptase • Important target in AIDS-related drug design • Biological role is to transcribe viral RNA into dsDNA, which is necessary for viral replication • Recently, many crystal structures of NNRTI’s (non-nucleoside reverse transcriptase inhibitors) with HIV-1 RT have been solved • Since 3-D structures are available, HIV-1 RT poses as a good target for drug lead development/screening By showing that their methodology is accurate for HIV-1 RT, the authors hope to demonstrate that the method can be widely applied to other systems where target 3D structures are available.
Evaluation Criteria for Database Screening Performance Hit rate = known inhibitors that passed filter(s) total number of known inhibitors in database Enrichment factor = (Hit rate) x total number of compounds in database total number of hits that passed filter(s) Method Outline and Evaluation Database = Refined ACD (Available Chemical Directory) DB of 150,000 compounds
Computational MethodsFilter 1: Pharmacophore Model What is a pharmacophore model? Defined as the three-dimensional arrangement of atoms - or groups of atoms – responsible for the biological activity of a drug molecule. 19 crystal structures of HIV-1 RT in complex with NNRTI’s tri-feature pharmacophore model
Computational MethodsFilter 1: Pharmacophore Model wing head • 19 HIV-1RT/NNRTI crystal structures were superimposed on PDB structure 1uwb (HIV-1 RT/TBO) • Spheres indicate where inhibitor atoms reside • Overall shape of bound inhibitors is like a butterfly (allosteric binding site of enzyme) wing tail
Computational MethodsFilter 1: Pharmacophore Model • Tri-featured pharmacophore model designed from the “butterfly” shape • X1 : represents a 5 or 6 membered aromatic ring • X2 : represents a 5 to 7 membered ring • X3 : represents nitrogen, oxygen, or sulfur • Distinct distance patterns were also identified
Computational ResultsFilter 1: Pharmacophore Model • Average RMSD of the 19 superimposed NNRTI’s = 0.86 angs. • 40,000 compounds / 150,000 passed this filter • Hit rate = 95 % • Enrichment factor = 3.56
Computational MethodsFilter 2: Multiple-Conformation Rigid Docking • Spheres, where inhibitor atoms could potentially be, were highlighted on HIV-1 RT/TBO reference structure • Cluster analysis selected one cluster consisting of 30-40 spheres around the binding site and chose this as a center for docking • Conformational searches for the hits having passed Filter 1 • Average Number of searched conformations for each molecule = 30 • Rigid Docking was performed for all conformations • Crucial docking parameters: • Maximum orientations = 1000 • Minimum matching nodes = 4 • Maximum matching nodes = 15 • No intramolecular score • Dielectric constant = 4.0
Computational ResultsFilter 2: Multiple Conformation Rigid Docking • Average RMSD of the 19 superimposed NNRTI’s = 0.86 angs. • 16,000 compounds / 40,000 had atleast 1 conformation that passed this filter • Hit rate = 76 % • Enrichment factor = 1.89
Computational MethodsFilter 3: Solvation Docking • Solvation docking parameters in the binding free energy formula could easily vary from system to system • To derive solvation docking model specific for HIV-1 RT, a training set of 12 known HIV-1 RT/NNR-TI crystal structures were used • Each molecule in training set had an RMSD < 3.0 angstroms between the docked and crystal structure • Parameters (alpha, beta, gamma) in formula I were optimized to reproduce experimental binding free energies Formula I: • Solvation docking was performed for molecules having passed filter II using a solvation docking program • Program outputs the following terms: 1)VDW energy (hydrophobic interaction) 2)Screened electrostatic energy 3)Polar and non-polar accessible surface areas • Using derived solvation docking model, binding free energies were calculated
Computational ResultsFilter 3: Solvation Docking • The solvation docking model with the following coefficients was produced ( Alpha = 0.1736, beta = 0.1709, gamma = 0.0049 ) • Solvation docking model achieved average unsigned and rms errors of 1.03 and 1.16 kcal/mol between deltaG(calc) and deltaG(expt) for the training set
Computational ResultsFilter 3: Solvation Docking • 3360 compounds / 16,000 passed this filter with a threshold of –8.8 kcal/mol • Hit rate = 79 % • Enrichment factor = 3.74
Computational MethodsFilter 4: MM-PB/SA • First 3 filters: only ligand flexibility was taken into account • Current filter: application of MD simulations to sample conformational space of BOTH inhibitor and receptor • For each molecule, MD simulations were done at 300 K with 2.0 fs time step • MD simulations carried out using this formula: • The inhibitor, water molecules, and receptor residues that are within 20 angs. Of inhibitor mass center were allowed to move during the simulations • Equilibration for 50 ps 20 snapshots were collected • For each snapshot: MM-PB/SA analysis was performed to calculate binding free energy
Computational ResultsFilter 4: MM-PB/SA • Because this is the most time/resource demanding step, MM-PB/SA was only done on the 22 molecules in the control set & 30 top hits that passed Filter 3 • 16 / 22 control hits from Filter 3 yielded MM-PB/SA scorese < - 6.8 kcal/mol • 10 / 30 top hits tested yielded MM-PB/SA scores < - 6.8 kcal/mol • Best hit had a binding free energy of – 17.7 kcal/mol (likely to be a real HIV-1 RT inhibitor)
Summary Results • Overall, 16/37 known NNRTs survived all filters • Overall hit rate = 41 % • Hit rate (first 3 filters) = 56 % • Enrichment rate (first 3 filters) = 25 Translates to: the probability of finding a real inhibitor randomly from the hits of the first 3 filters is 25 fold higher than from the whole database Conclusion The hierarchical multiple-filter database searching strategy attained both high efficiency and high reliability, making it a viable option for drug lead discovery. Future Development • Making the time/resource limiting step, MM-PB/SA, more efficient • Run MD simulations using implicit (rather than explicit) water models such as GB/SA and PB/SA • Development of new algorithm to calculate entropy accurately and efficiently