Download
1 / 44
440 likes | 550 Views
Frameworks for leadership: Mental models for process management. Instructional Leadership Training (ILT) November 27, 2012. Desired outcomes. Understand some of the basic components of the new accountability system for 2013 and beyond

E N D
Frameworks for leadership: Mental models for process management Instructional Leadership Training (ILT) November 27, 2012
Desired outcomes • Understand some of the basic components of the new accountability system for 2013 and beyond • Generate feedback on a draft CBA analysis protocol for calibrating the work of PLCs • Learn how to generate some key administrator data views in Aware, Forethought and Workshop • Recognize the importance of monitoring processes when PLCs plan for learning
Index-based accountability Index 1 Student Achievement Score 0-100 ? Index 2 Student Progress Score 0-100 Rating Index 3 Closing Performance Gaps Score 0-100 Index 4 Postsecondary Readiness Score 0-100
Index 1 – Student Achievement • Begins 2013 • Performance standards • STAAR 3-8 and EOC: Final Level II (Satisfactory) • TAKS: Met Standard (2013 only) • Assessments • STAAR, STAAR-M (w/cap), STAAR-Alt (w/cap), STAAR-L (TBD) • TAKS, TAKS-M (grade 11) • Administrations • Grades 5 & 8: First 2 administrations • EOC: Primary admin, spring and previous summer and fall • EOC (MS): No double-testing
Index 1 – Student Achievement • Subjects • Reading, Math, Writing, Science, Social Studies • Student groups • All students only • Accountability subset • STAAR 3-8: Fall snapshot • EOC • Fall snapshot for spring and previous fall • Previous year snapshot for previous summer Subset based on Oct 2011 snapshot Subset based on Oct 2012 snapshot
Index 1 – Student Achievement • Methodology • Results summed across tests, subjects, grade levels Number of tests at Final Level II (STAAR) and Met Standard (TAKS) Number of tests taken
Index 2 – Student Progress • Begins 2014 • Growth standards: TBD • Transition table model to determine growth Level I Unsatisfactory Level II Satisfactory Level III Advanced 2013 2014 2013 2014 Level I Low Level I High Level II Low Level II Mid Level II High Level III Low Level III High 2014 2013 2013 2014
Index 2 – Student Progress • Subjects • Reading, Math, Writing (EOC only) • Science, Social Studies (TBD for EOC only) • Accountability subset • Same as for Index 1 • Student groups • All students • ELLs, Special Education • All seven race/ethnicity groups • Minimum group size: 20
Index 2 – Student Progress • Methodology • Results summed across tests and grade levels • Analyzed by subject and by student group Number in student group who met growth standard for subject Number in student group tested in subject
Index 3 – Closing Performance Gaps • Limited in 2013, final form in 2014 • Assessments and subjects • Same as Index 1 (all tests, all subjects, w/cap) • Accountability subset • Same as Index 1 • Minimum group size: 20 • Student groups • Economically disadvantaged • Two lowest-performing race/ethnicity groups from previous year • Alternate method used if only 1 or 2 subgroups
Index 3 – Closing Performance Gaps • Performance standard • Level II Final (2013 and beyond) • Level III (2014 and beyond) • Methodology • Summed across tests and grade levels • Results analyzed by subject and student group • Results are weighted • One point for each percentage point of students in the group meeting the Level II standard • Two points for each percentage point of students in the group meeting the Level III standard
Index 4 – Postsecondary Readiness 1. STAAR Percent Met Level III Standard • Begins 2014 • Assessments and subjects • Same as Index 1 (all tests, all subjects) • Accountability subset • Same as Index 1 • Minimum group size: 20 • Student groups evaluated • All students and seven race/ethnicity subgroups
Index 4 – Postsecondary Readiness 1. STAAR Percent Met Level III Standard • Methodology • Results summed by grade level, tests and subjects • Analyzed by student subgroup
Index 4 – Postsecondary Readiness 2. Grade 9-12 Graduation Rate • Begins 2013 • Standard • State-defined graduation rate as per statute • Four- and five-year rates used • Student groups • All students, ELLs, special education, seven race/ethnicity • Minimum group size: 20
Index 4 – Postsecondary Readiness 2. Grade 9-12 Graduation Rate • Methodology (four-year and five-year) Number of Graduates in cohort Graduates + Continuers + GED Recipients + Dropouts
Index 4 – Postsecondary Readiness 3. Recommended/Advanced High School Program • Begins 2013 • Student groups • All students, seven race/ethnicity groups • Minimum group size: 20 • Methodology Number graduates with RHSP or AHSP Total number of graduates
Index 4 – Postsecondary Readiness Index Construction • Graduation score (high school only) • Four- or five-year graduation rate, whichever is best • RHSP/AHSP graduates • STAAR score • Percent met Level III (2014 and beyond) • For high schools the graduation score and STAAR scores are averaged to determine overall index score
Index-based accountability Index 1 Student Achievement 45 ? Index 2 Student Progress 42 Rating Index 3 Closing Performance Gaps 48 Index 4 Postsecondary Readiness 56
Other accountability issues • Unification of state and federal systems may not be approved • ELL progress measures still undecided • Three-year averaging required by statute • Two possible campus and district ratings in 2013 • Met Standard • Improvement Required • One higher-level distinction available in 2014 for districts based on postsecondary readiness • Tier 1 & Tier 2 akin to Exemplary and Recognized
Other accountability issues • Campus distinctions • Postsecondary readiness (1st or 2nd tier) • Top 25% - Closing the Gap and Student Progress • Academic Achievement (Reading, Math, Science, Soc St) • 21st Century Workforce Development • Fine Arts, Physical Education • Second Language Acquisition • Timeline • March 2013 – Commissioner final decisions • May 2013 – Accountability Manual released
Draft CBA Analysis Protocol Setting context Gathering feedback
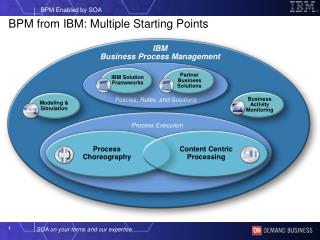
Strategic Planning Process Management Human Resource Focus Strategic Performance Results Operational Measurement, Analysis & Knowledge Management Core Values Managing processes Goals and measurable objectives Leadership Customer requirements Student & Stakeholder Focus Leading indicators Strategic actions
Why do effective leaders monitor and manage instructional processes? • Processes are the system component over which we have the most control • It is the most effective (and only?) way to leverage improvement in delivery • It provides agility to respond to internal and external changes in the system
The L stands for Learning • No single person knows how to do all of this perfectly • We are on a collaborative learning journey
Context surrounding CBAs • Primary purpose: Provide data to C&I staff to assess the curriculum • Secondary purpose: Provide PLCs with data on rigorous, aligned items to help calibrate design of assessments and instruction • Not intended to be a comprehensive assessment of student mastery of the TEKS in previous 9 weeks of instruction
Assessment for Learning Model Planning and delivering an instructional unit Curriculum PLC SEs Redesign PLC PLC Content, Context, Cognition Regroup Reteach Reteach Common assessment Lesson 1 Lesson 2 Lesson 3 Lesson 4 Formative assessment (FA) FA FA http://www.youtube.com/watch?v=OtKr23ZGV-s
Assessment for Learning model • Model • An example for imitation or emulation • A description or analogy used to help visualize something that cannot be directly observed • “Essentially, all models are wrong, but some are useful.” - George Box • Help teachers visualize how parts of a process fit together into a cohesive whole • Help leaders identify key places to monitor processes and identify opportunities for learning
The AFL Model and the 4 PLC questions Planning and delivering an instructional unit Curriculum PLC SEs Q1 Q3 Redesign PLC PLC Content, Context, Cognition Q3 Regroup Reteach Reteach Q2 Common assessment Lesson 1 Lesson 2 Lesson 3 Lesson 4 Q2 Formative assessment (FA) FA FA Q4
The AFL Model and eduphoria! Planning and delivering an instructional unit Curriculum PLC SEs forethought forethought aware Redesign PLC PLC Content, Context, Cognition Regroup Reteach Reteach forethought Common assessment aware Lesson 1 Lesson 2 Lesson 3 Lesson 4 Formative assessment (FA) FA FA aware
The AFL Model and managing processes Planning and delivering an instructional unit Curriculum PLC SEs Redesign PLC PLC Content, Context, Cognition Regroup Reteach Reteach Common assessment Lesson 1 Lesson 2 Lesson 3 Lesson 4 Formative assessment (FA) FA FA
AFL Model and the CBA Analysis Protocol CBA Analysis Protocol Calibrate alignment between classroom instruction, common assessments and district CBAs C&I PLC PLC Regroup, Reteach, Redesign District CBA Common assessment CA CA CA Instruction FA FA Unit 1 Unit 2 Unit 3 Unit 4
Taught Written Tested Draft CBA Analysis Protocol • It’s about alignment, learning and improving processes • It’s not about compliance Standards
Draft CBA Analysis Protocol • Designed to lead PLCs through a thought process • Identify items where students had difficulty • Compare how SEs were addressed in items with how they were addressed in the taught and tested curriculum • Compare performance on the SEs with performance on the state test last year • Determine if and how these SEs will be re-addressed in current year • Determine how instruction and assessment will be modified the next time these areas are taught
(+) (∆) (–) • Consider as a group the draft protocol in light of the context just discussed • Determine if there are components that should be added to the protocol. Provide a rationale for why they should be included. • Identify components that could be improved through change, what those changes should be, and your rationale • Identify components that should be deleted and your rationale
Questions? David F. Holland – Accountability, Research and Program Evaluation david.holland@birdvilleschools.net 817-547-5801