Download
1 / 30
320 likes | 519 Views
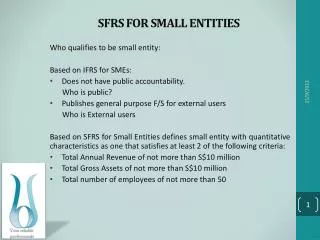
Small to Medium Enterprises (SMEs) and Macro Economic Indicators. Presented by Arti Triveni and Janet Turvey. Purpose of the Research. To investigate whether SMEs in Hawke’s Bay found any relevance for and use the macro economic indicators available at both national and regional level.

E N D
Small to Medium Enterprises (SMEs) and Macro Economic Indicators Presented by Arti Triveni and Janet Turvey
Purpose of the Research • To investigate whether SMEs in Hawke’s Bay found any relevance for and use the macro economic indicators available at both national and regional level. • As tutors of Economics and Small Business Management at EIT we had become aware of the difficulties that small businesses have in this regard.
Purpose of Study cont. • SMEs are very vulnerable to macro economic events beyond their control. • Many previous studies on SMEs had focused on other problems such as planning, lack of capital, cash flow crises, marketing, staffing and operations difficulties. • We considered there might be a problem for SMEs in that they often lacked the time to keep abreast of the bigger economic picture. • This was primarily a needs analysis funded by the Business Links Funding.
Research Method Undertaken • A gathering of existing macro economic data from various sources. • A literature review • Interviews with twelve varied local small business operators in Hawke’s Bay. • Interviews and surveys with a number of economists including Sean Bevin who provides data for the Napier City Council and John Bon Verhoven from Hastings District Council.
Research Method continued • A study of economic data on the Hawke’s Bay region. • A focus group of eight selected businesses from the local community. • A questionnaire was prepared which focused on a list of macro economic indicators selected from the previous discussions and this was sent to 500 local businesses randomly selected from the Yellow Pages.
Research Method continued • By three weeks 94 surveys were returned completed and 16 were returned undelivered. This gave a response rate of 19.42%. • Three were discarded due to less than 30% of the questions being answered. • Minitab software was used for collation. • A final report was presented to Business Links Funding in early March 2006. • Press release in April 2006.
Findings: Literature Review • There did not appear to be any recent studies on this topic. • Don Brash had produced a conference paper highlighting the need for the Reserve Bank to better communicate to small businesses the impact of global events such as the Asian crisis (Dec. 1998).
Findings: Literature Review Continued • A paper by Rufus Dawe (Sleeping Dogs Beware, NZ Business Nov. 1987) had discovered the need for businesses in general to be following GDP, private consumption, balance of payments, inflation, unemployment and the Government’s financial budget.
Findings from Qualitative Research • Interviews with small business operators such as a hairdresser, carpet cleaner, draughtsman, real estate agent, travel agent, farmer, energy consultant found that they do often look at the information if it is relevant to them. • According to Bevin and Bon Verhoven (2005), it appeared that there was much information available on economic indicators and the region’s growth but the challenge was to get businesses to apply them.
Findings from Quantitative Research • Of business respondents, 56% had 1-5 employees (classed as micro), 29% had 6-20 employees (small). Only 10% had 21+ employees. Of those replying, 5% did not respond to that question. • Only 50% of respondents received information on economic indicators. There didn’t appear to be any correlation on the type of business and whether they received economic information.
Findings continued • Most businesses used the newspaper on a daily basis as their major source of economic information. • Forty- eight percent of businesses consult someone on economic indicators. • The most popular type of consultant on economic indicators were accountants (see table on the next slide)
Findings continued: Planning and Economic Indicators • Of all the businesses that receive information on economic indicators, 11 responded that they read it and file it, 11 read it and use it. A further ten businesses read it and trash it. • Of the operators receiving information on economic indicators 27 used the information sometimes whilst only three used it always for the planning of their businesses. • Three never used the information received.
Findings continued: Management and Economic Indicators • Twenty nine businesses sometimes used the information received for managing their businesses. • Two always used the indicators for managing their businesses. • Four stated they never used the information.
Findings continued: Reasons for not using the Information • Businesses found that lack of time(33%), lack of access(15%) and a lack of interest(15%) were the major constraints to using economic indicators. Cost accounted for only 4% of the answers. • Some other comments were that they lagged behind reality or they had no value in operating their business.
Findings continued: Economic Indicators • Please look at the table provided to view the complete list of indicators which are extracted from the original report. • The following indicators were the ones which featured most as being difficult to understand: • Producer Price Index (inputs) (48%) • Producer Price Index (outputs)(48%) • 10 Year Government bond rate(30%) • Government operating balance(36%)
Findings continued: Indicators and ease of understanding • From the research, there were a number of indicators that our respondents found “very easy to grasp the meaning and implications of “. • These were generally also the ones they found “Directly relevant to their business” or had “Some relevance to their business”. • See the table on the next slide.
Retail Sales 48% Export Prices 32% Import Prices 30% Business Confidence 43% Employment 38% Credit Card Billings 43% Net migration 44% Regional Trends 31% Consumer Confidence 45% Labour Cost (wages) 43% Current Account Balance 38% Savings Rate 33% New Car regs 49% Unemployment 46% Population growth 49% Indicators that were most easily understood (percentage)
Findings continued: Most Relevant to their businesses • The same list of indicators was provided in order to discover which ones were most relevant to SMEs. • Please look at the tables provided.
Limitations • This research took place between September 2005 and November 2005. • It appeared from the response rate(19.42%) that the timing was not favourable to the businesses surveyed. • Many businesses appeared to be either too busy as Christmas approached or not interested in completing the questionnaire.
Conclusions (General) • There was plenty of information on up to date economic data at national level via the banks, the news media, trade associations and Statistics New Zealand. • The question was whether it was in a readable form for the small business person.
Conclusions (Qualitative Findings) • Several interviews plus the focus group indicated that SMEs are only interested if the indicators had a direct bearing on their business. • Their main focus was on the daily operations of their business.
Conclusions Continued • Those businesses who were computer literate had no problem sourcing information. • The question might be their ability to source information at the regional level for the average SME. • The authoritative summary by Bevin, ‘The Napier/Hawke’s Bay Monitor’, may be overlooked by many businesses.
Conclusions from Literature Review • The study did not uncover any recent studies on this topic at a regional level. • There were many journal articles on SMEs, and also on economic indicators but linking them together was difficult. • The Chamber of Commerce commented that they were becoming aware of a deficiency in this area.
Conclusions (quantitative findings) • The majority(56%) of businesses surveyed in Hawke’s Bay have 1-5 employees. This supports Government statistics that show 86% for 0-5 employees. • Not all businesses(50%) receive information on economic indicators regularly. • Most of the operators used the information only sometimes for planning and managing.
Conclusions continued • 48% of businesses consult someone on economic indicators and accountants were the most often consulted (52%). • Lack of time was considered to be the major constraint in using economic indicators(33%).
Conclusions continued • The economic indicators that appeared to be most relevant to their operations were Population growth, Consumer confidence, Business confidence, Employment, Real GDP (economic growth), Labour cost (wages), Future expectations and Regional trends.
Recommendations • It is suggested that possibly the Reserve Bank might consider defining and simplifying the economic indicators to make it easier for small business operators without specialist financial staff to understand the meaning and implications of them. • It is possible that there is scope for a simple one page bullet point summary on a regular basis to be provided for small businesses in the region.
Recommendations continued • It is recommended that a similar research be carried out in 2007 in order to evaluate whether change has taken place.