Download
1 / 27
270 likes | 402 Views
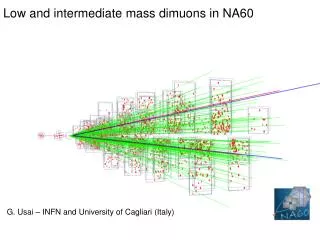
NA60 results on charm and intermediate mass dimuon production in In-In 158 GeV/A collisions. Introduction NA60 apparatus and data treatment Intermediate mass region (IMR) analysis Summary. R. Shahoyan, IST (Lisbon) on behalf of the NA60 collaboration. Quark Matter 2006, Shanghai.

E N D
NA60 results on charm and intermediate mass dimuon production in In-In 158 GeV/A collisions • Introduction • NA60 apparatus and data treatment • Intermediate mass region (IMR) analysis • Summary R. Shahoyan, IST (Lisbon)on behalf of the NA60 collaboration Quark Matter 2006, Shanghai
NA38/NA50 proton-nucleus data centralcollisions M (GeV/c2) Previous measurements of the intermediate mass (1.2<M<2.7 GeV/c2) dimuons • NA38/NA50 was able to describe the IMR (between and J/) dimuon spectra in p-A collisions at 450 GeV as the sum of Drell-Yan and Open Charm contributions. • However, the yield observed by NA50 in heavy-ion collisions (S-U, Pb-Pb) exceeds the sum of DY and Open Charm decays, extrapolated from the p-A data. • The study of this excess was one of the main objectives of the NA60 experiment at SPS. The preliminary analysis of Indium-Indium collisions at 158 GeV/A showed that the excess is caused by prompt dimuons and not by charm (QM05).
muon trigger and tracking iron wall magnetic field targets hadron absorber muon other tracks Concept of NA60 2.5 T dipole magnet vertex tracker beam tracker Concept of NA60: place a silicon tracking telescope in the vertex region to measure the muonsbefore they suffer multiple scattering in the absorberand match them to the tracks measured in the muon spectrometer Improved kinematics; dimuon mass resolution at the :~20 MeV/c2 (instead of 80 MeV/c2 in NA50)Origin of muons can be accurately determined
Muon Matching Muons from the Muon Spectrometer are matched to the Vertex Telescope tracks by comparing the slopes and momenta. Each candidate passing a matching 2 cut is refitted using both track and muon measurements, to improve kinematics. Most background muons from and K decays are rejected in this matching step… buta muon might be matched to an alien track (or to its proper track which picked too many wrong clusters) Fake matches, additional source of background By varying the cut on the matching 2 we can improve the signal/background ratio
Beam Trackersensors windows Vertex resolution (along the beam axis) Good target identification even for the most peripheral collisions ( 4 tracks) The interaction vertex is identified with better than 200 mm accuracy along the beam axis
(m) Dispersion between beam track andVT vertex 30 20 10 Vertex resolution (assuming sBT=20 mm) Number of tracks 0 BT BT Vertex resolution (in the transverse plane) Beam Tracker measurement vs. vertex reconstructed with Vertex Telescope The BT measurement (with 20 m resolution at the target) allows us to control the vertexing resolution and systematics The interaction vertex is identified witha resolution of 10–20 mm accuracy in the transverse plane
J/ muons are almost background free and come from the interaction vertex (no B decays at SPS energies) used to monitor the resolution of the transverse distance of the track at the vertex: ~40 m • Data were realigned after QM05 - the non-Gaussian tails caused by misalignment are reduced. • Good enough to separate prompt dimuons from Open Charm off-target decays ! vertex impact < c (D+ : 312 m, Do : 123 m) • To eliminate the momentum dependence of the offset resolution, we use the muon offset weighted by the error matrix of the fit: • Dimuon weighted offset: Offset resolution
Our measured dimuon spectra consist of: correctly matched signal signal muons from the spectrometer are associated with their tracks in the Ver.Tel. wrongly matched signal (fakes)at least one of the muons is matched to an alien track correctly matched combinatorial pairsmuons from ,K decays are associated with their tracks or with the tracks of their parent mesons association between the ,K decay muon and an alien track All these types of backgroundare subtracted byEvent Mixingin narrow bins in centrality, for each target, and magnetic field polarities (~2300 samples) wrongly matched combinatorials (fakes) Background Subtraction
CBmixing Background Subtraction Combinatorial Background (mainly from uncorrelated and K decays)Subtracted by building a sample of pairs using muons from different Like Sign events.Mixing procedure accounts for correlations in the data due to the dimuon trigger.The normalization for the Opposite Sign sample is computed analysticaly.
CBmixing Background Subtraction Subtracting the Mixed CB from the data we obtain the Signal (correct and fake) in +- sample and zero (or residual background) in the Like Sign dimuons sample.
CBmixing Fakesmixing Background Subtraction The Fake Matches Background is subtracted by Monte Carlo (used for the Low Mass Analysis) or by matching the muons from one event to tracks from another one; a special weighting procedure is used to account for the mixed fake matches…
CBmixing Fakesmixing FakesCBmixing In order to extract from the fake matches the signal contribution we repeatthe Combinatorial Mixing procedure for the generated fakes sample, obtaining the combinatorial fake matches Background Subtraction
CBmixing Fakesmixing FakesCBmixing Subtracting the combinatorial fakes from all fakes we obtain the fake signal Background Subtraction
CBmixing Fakesmixing FakesCBmixing Subtracting the fake signal from the total matched signal leads to the correct signal spectrum Background Subtraction
mixed event event 1 event 2 Background Subtraction The quality of combinatorial subtraction can be controlled by comparing the built mixed event Like Sign dimuon spectra to the corresponding measured data. Accuracy is better than 1% The residual background of Like-Sign dimuons sample is accounted as a systematic error The “mixed” background sample (fake matches and combinatorial) must reproduce the offsets of the measured events: therefore, the offsets of the single muons (from different events) selected for mixing must be replicated in the “mixed” event. 1.16<M<2.56
Signal Fake Matches Background Subtraction: results 2 data samples with different current settings in the Muon Spectrometer magnet(changes acceptance)Kinematical domainselected for this study:1.16 < M < 2.56 GeV/c20 < yCM < 1|cos| < 0.5
Signal/Background dependence on matching cut Variation of the matching 2 from 3 to 1.5 increases the Signal/Background by factor 2 (at the expense of ½ of the signal)Used to check the systematics of the background subtraction
NA60 Signal analysis: simulated sources Charm and Drell-Yan contributions are obtained by overlaying real data on Pythia 6.326 events (CTEQ6L PDFs with EKS98 and mc=1.5 GeV/c2. kT=0.8 for Drell-Yan and 1 for Charm) The fake matches in the MC events are subtracted as in the real data Relative normalizations: • for Drell-Yan: K-factor of 1.9; to reproduce measured cross-sections of NA3 and NA50 • for Charm: 13.6 b/nucleon needed to reproduce the extrapolated cross section fromNA50 p-A dimuon data at 450 GeVNote: this is factor 2 larger than the “world average”, but: we detect only in |cos|<0.5 shows very strong rise at large cos Our full phase space acceptance of charm strongly depends on the correctness of Pythia. Absolute normalization: the expected DY contribution, as a function of the collision centrality, is obtained from the number of observed J/ events and the suppression pattern (talk of E.Scomparin).A 10% systematical error is assigned to this normalization. Signal shapes used to fit the weighted offset distributions are:prompt dimuons: mixture of J/ and datacharm: MC smeared by amount needed to reproduce J/ and by MC The fits to mass and weighted offset spectra are reported in terms ofthe DY and Open Charm scaling factors needed to describe the data
Data integrated in collision centralities and in PT Fit of the mass spectra with prompts fixed to Drell-Yan (within 10%) shows that the dimuon yield in IMR is higher than expected … 4000 A, 2 <1.5 Fit range 6500 A, 2 <1.5
4000 A, 2 <1.5 4000 A,2 <1.5 Fit range 6500 A, 2 <1.5 6500 A, 2 <1.5 Data integrated in collision centralities and in PT Fit of the mass spectra with prompts fixed to Drell-Yan (within 10%) shows that the dimuon yield in IMR is higher than expected … and the fit to the offset spectra shows that the excess is prompt.
4000 A, 2 <1.5 4000 A, 2 < 3 6500 A, 2 <1.5 6500 A, 2 < 3 Offset fits with free prompt and charm normalizations: Requires ~2.4 times more prompts than what Drell-Yan provides. Obtained Charm contribution is lower than extrapolation from NA50 p-A data The two data sets, with different systematics, are consistent with each otherCharm will be fixed to 0.7 0.15
All data preliminary Corrected for acceptance The acceptance correction of the excess is done differentially in M and PT (does not require the knowledge of true distributions) and assuming flat cos distribution for decay angle rapidity distribution similar to Drell-Yan (y~1) Centrality dependence of the excess Slight increase w.r.t. Drell-Yan, versus number of participants
Drell-Yan Charm No acceptance correction 6500 A (T in GeV) ExcessCorrected for acceptance preliminary PT dependence of the excess (1.16<M<2.56 GeV/c2) PT spectrum of the excess, especially at high PT, strongly depends on the correctness of Drell-Yan description by Pythia (and charm on lesser extent)TEFF. fits are performed in 0< PT <2.5 GeV/c
Relative excess vs PT at 1.16<M<2.56 GeV/c2 preliminary Corrected for acceptance All data
Contributions to IMR in-0.5 < cos < 0.52.92 < ylab < 3.92 (both 4000 and 6500 A data sample used) preliminary Corrected for acceptance TEFF in MeV ( 0 < pT < 2.5 GeV/c) for excess Estimated systematic errors on TEFF are ~20 MeV
Summary Prompt dimuons production is ~2.5 higher than the expected Drell-Yan in Indium-Indium collisions at 1.16 <M < 2.56 GeV/c2. Charm production is compatible with expectations. Prompts/Drell-Yan slightly increases with number of participants. Excess contribution is dominated by low PT’s, reaching a factor 3.50.4 for PT<0.5 GeV/c. The effective temperature of the excess (~190 MeV) is considerably lower than the temperatures observed at lower masses (both for the resonances and the low-mass excess) Results are preliminary, since they depend on the correctness of used Drell-Yan and Charm contribution PT distributions. Need to be verified with pA data