Download
1 / 9
90 likes | 200 Views
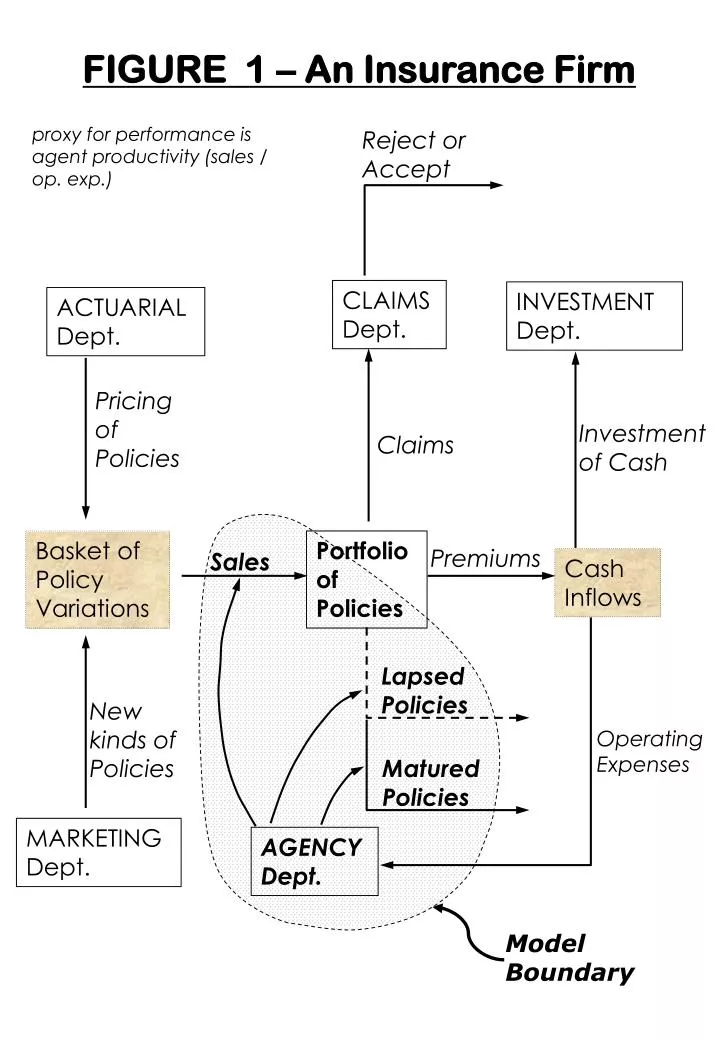
FIGURE 1 – An Insurance Firm. proxy for performance is agent productivity (sales / op. exp.). Reject or Accept. CLAIMS Dept. INVESTMENT Dept. ACTUARIAL Dept. Pricing of Policies. Investment of Cash. Claims. Basket of Policy Variations. Portfolio of Policies. Premiums. Sales.

E N D
FIGURE 1 – An Insurance Firm proxy for performance is agent productivity (sales / op. exp.) Reject or Accept CLAIMS Dept. INVESTMENT Dept. ACTUARIAL Dept. Pricing of Policies Investment of Cash Claims Basket of Policy Variations Portfolio of Policies Premiums Sales Cash Inflows Lapsed Policies New kinds of Policies Operating Expenses Matured Policies MARKETING Dept. AGENCY Dept. Model Boundary
FIGURE 2 – Productivity of the 3 groups Productivity is measured in UK £ per person per year FIGURE 3 – Normalized Productivity The y-axis has been normalized, base set to 100
FIGURE 4 - Model Boundary proxy for performance is agent productivity (sales / op. exp.) Reject or Accept CLAIMS Dept. INVESTMENT Dept. ACTUARIAL Dept. Pricing of Policies Investment of Cash Claims Basket of Policy Variations Portfolio of Policies Premiums Sales Cash Inflows Lapsed Policies New kinds of Policies Operating Expenses Matured Policies MARKETING Dept. AGENCY Dept. Model Boundary
FIGURE 5 – Model Overview manager quit rate MANAGER MANPOWER growth target lost skill from promotion Agents promotion rate agent quits agents promoted SKILL HEADCOUNT hires Agents skill per agent achieved growth rate de-facto growth target PRODUCTIVITY ATTITUDE TO GROWTH TARGET products lapsing product sales skill level of hired agents impact on lapse rate agent quit rate COMPENSATION SECTOR MANAGERIAL COMPENSATION variable agent compensation
FIGURE 6 - Skill Sector modified by Agent Learning skill per agents quits agent hires relative skill lost skill agents promoted of quits from quits Agents' Sales Skill added skill lost skill from at hire promotions agent learning standard relative skill of level of agent skill hired agents promoted agents at hire Agent Learning Rate impact of recent compensation Agents PRODUCTIVITY SECTOR HEADCOUNT SECTOR HEADCOUNT SECTOR HEADCOUNT SECTOR COMPENSATION SECTOR + + + + + + + +
FIGURE 7 - Time Allocation Sector MANAGER MANPOWER SECTOR standard manager skill working days per skill per Managers year per manager manager + + + relative + effect of relative managerial efficiency manager skill time available of managers on efficiency weight to recruiting - - share of time + shortfall of allowed for shortfall each activity each activity + ratio SKILL SECTOR HEADCOUNT SECTOR total time time required + needed on each activity + + + ratio admin + target days of + days needed indicated indicated coaching per per recruit recruiting time coaching time agent in a year target number Agents of recruits HEADCOUNT SECTOR
FIGURE 8 – Differences in Performance Net products sold per year Skill per agent 108K 6 83K 5 58K 4 33K 3 2 8000 0 4 8 12 16 20 0 4 8 12 16 20 Time (year) Time (year) Units: policies per year (left) and equivalent years of experience (right) Alpha: Full weight to recruiting Beta: Full weight to training FIGURE 9– Divergence in Size Units: dimensionless (left) and agents (right) Agents (size of sales force) Graph for achieved growth rate 1600 0.20 0.15 1200 0.10 800 0.05 400 0.0 0 0 4 8 12 16 20 0 4 8 12 16 20 Time (year) Time (year)
FIGURE 10 - Attitude to Growth Target time HEADCOUNT SECTOR constant 1 achieved growth rate - + change in perceived growth rate time - constant 2 perceived weight to sales growth rate growth target + - - + + Adjustment factor for change change in target in target de-facto - growth target Sales Growth Target
FIGURE 11 – Differences in Performance Net products sold per year Skill per agent 10 105K 8.6 85K 7.2 65K 5.8 45K 4.4 25K 3.0 2.2 5K 0 4 8 12 16 20 0 4 8 12 16 20 Time (year) Time (year) Units: policies per year (left) and equivalent years of experience (right) Alpha-x: Full weight to recruiting Beta-x: Full weight to training FIGURE 12– Divergence in Size Units: dimensionless (left) and agents (right) Agents (size of sales force) Graph for achieved growth rate 0.20 1800 0.15 1350 0.10 900 0.05 450 0.00 0 -0.05 0 4 8 12 16 20 0 4 8 12 16 20 Time (year) Time (year)