Download
1 / 13
130 likes | 248 Views
The Effects of Molecular Noise and Size Control on Variability in the Budding Yeast Cell Cycle. Talia et al, Nature, 23 August 2007 William Morejón Kelly Drinkwater. Recall the Yeast Cell Cycle. Yeast cells will grow like any other cell during the cell cycle Undergo Budding

E N D
The Effects of Molecular Noise and Size Control on Variability in the Budding Yeast Cell Cycle • Talia et al, Nature, 23 August 2007 • William Morejón • Kelly Drinkwater
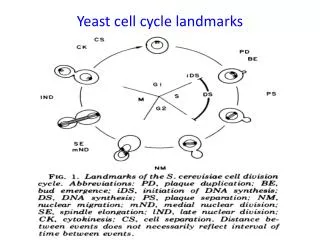
Recall the Yeast Cell Cycle • Yeast cells will grow like any other cell during the cell cycle • Undergo Budding • Results in a Mother and a Daughter • This paper is solely concerned with factors governing G1 transition to S phase in Saccharomyces Cerevisiae G1 D M
Variation in Length of G1 G1 Phase • Size-dependent regulation • Cells have differential birth size (Mbirth) • Cells will exit G1 once they have reached a certain size (Mbud) • Size-independent, fixed-time-length regulation • Molecular noise • Experimental Goal: • How much of G1 Variability is due to noise?
Measuring the Size Factor Mbud=MbirtheαT(G1) α=growth rate ACT1 RFP construct • Protein Based Marker for cell Size • DsRed Red Fluorescent Protein under constitutive promoter (ACT1 from actin gene) • Total Red Fluorescence per cell reflects total cell protein content • Found Exponential Growth • For small Mbirth, TG1 is longer • For large Mbirth, TG1 is smaller *Implies size factor
Measuring the Time Factor • If cycle timing controlled by noisy gene expression, then N x ploidy reduces variability • Used haploid, diploid and tetraploid (next slide) • Strains carry Myo1-GFP • Forms a ring @ new bud neck • Disappears at Cytokinesis *Allows us to measure G1 time
Ploidy and Noise in G1 • Increased Ploidy reduces noise • WT Haploid-some noise • WT Diploid-less noise • WT Tetraploids least noise • Variability decreased by sqrt(2) for each increase in ploidy • Noise may be due to small variability in numbers of regulator molecules
Size-dependent timing in smaller cells • Relate birth size to G1 duration • Small daughter cells show strong dependency; others weak
Whi5 acts as a gatekeeper • In the nucleus, Whi5 inhibits DNA replication & budding proteins • Cyclins drive it to the cytoplasm, releasing inhibition • Divide G1 into parts T1 and T2
Size control occurs in T1 • T1 varies with cell size just like overall G1 (two-slope model); very short in mothers • T2 is independent of cell size, same in mothers & daughters
Contributions • Separated variation in G1 length due to cell size, fixed-duration steps, and molecular noise • Demonstrated role of molecular noise due to 1/sqrt(2) change with ploidy doubling • Proposed two-step model of yeast G1 phase, with size- and time-regulated steps
What Bioengineers Can Use • Use ploidy or copy number as a noise control mechanism in engineered networks • Better control of replication in engineered yeast populations • Better understanding of replication possibly applicable to other organisms
Methods: Time Lapse Microscopy • Cells were imaged every 3 min on a fluorescent microscope • Leica DMIRE2 inverted microscope with a Ludl motorized XY stage • Budding was scored visually by the appearance of Myo1–GFP at the incipient bud neck, and division by its disappearance, generally with single-frame accuracy. • Time-lapse microscopy data were analysed with custom software written in MATLAB